Another excellent blog showing the sharp decline in poverty rates in the USA after the US 1996 Federal welfare reforms that introduced lifetime time limits on eligibility.
There are two different ways of reading the information in the chart above.*
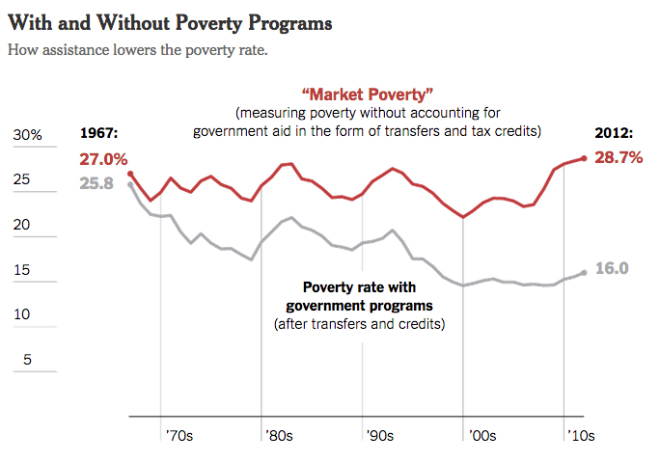
One way is that the various programs associated with the War on Poverty have succeeded, at least to some extent. That success can be seen in the difference between the “market poverty” rate (technically, the pretax/pretransfer anchored supplemental poverty rate) of 28.7 percent in 2012 and the “poverty rate with government programs” (technically, the anchored supplemental poverty rate) of 16 percent. Many fewer people are living at or below the poverty line with government transfers and tax credits than if those programs had not existed.
But there’s a second way of reading the chart: capitalism in the United States produces poverty at just about the same rate today (at 28.7 percent) as it did back in 1967 (when 27 percent of the U.S. population lived at or below the market poverty rate)—which makes it all that much more…
View original post 129 more words

Recent Comments