The Allocation of Talent and U.S. Economic Growth
05 Sep 2020 Leave a comment
in discrimination, economic growth, economics of education, gender, geography, human capital, industrial organisation, labour economics, labour supply, macroeconomics, occupational choice, occupational regulation, politics - USA, poverty and inequality, transport economics, urban economics Tags: creative destruction, racial discrimination, sex discrimination
What Does the Trump 2017 Tax Cut Imply for the U.S. Economic Growth, Inflation, and Government Debt?
08 Dec 2019 Leave a comment
in economic history, geography, history of economic thought, macroeconomics, Public Choice, public economics Tags: Ricardian equivalence
Uncertainty and Ambiguity in American Fiscal and Monetary Policies Thomas Sargent
28 May 2019 Leave a comment
in budget deficits, business cycles, currency unions, economic growth, economic history, economics of information, Euro crisis, financial economics, fiscal policy, geography, global financial crisis (GFC), great depression, great recession, law and economics, macroeconomics, monetary economics Tags: Thomas Sargent
Weird Borders: State Borders of the United States of America
15 Dec 2018 Leave a comment
in geography, International law Tags: maps
Hsieh and Moretti on Allocations across Cities
23 Jan 2015 Leave a comment
in applied price theory, applied welfare economics, economics of regulation, geography, law and economics, politics - New Zealand, politics - USA, rentseeking, urban economics Tags: agglomeration, green rent seeking, land supply, zoning
the implied cost of housing restrictions across the whole U.S., and Chang and Enrico find that aggregate output is lower by about 10-14% because of them.

Last post on the NBER growth session. Chang-Tai Hsieh (Chicago) and Enrico Moretti (Berkeley) presented a paper on wage dispersion across cities in the U.S. Wage dispersion (New Yorkers earn more than people in Cleveland) either represents compensation for living costs (housing in New York is more expensive than in Cleveland), a real difference in productivity (New Yorkers are more productive than Clevelanders), or some combination of the two.
What Chang and Enrico find is that the increase in wage dispersion across cities in the U.S. over the last thirty-ish years is due almost entirely to rising house prices in six cities: NY, DC, Boston, San Fran, San Jose, and Seattle. Wages have gone up rapidly in those cities, but that is basically just compensating their citizens for the higher costs of living.
Now, given the costs of living, the allocation of population across cities in the U.S. is…
View original post 274 more words
Real GDP per New Zealander and Australian aged 15-64, PPP, 1956-2013, $US
18 Nov 2014 1 Comment
in business cycles, economic growth, geography, global financial crisis (GFC), great recession, macroeconomics, politics - Australia, politics - New Zealand Tags: lost decades, prosperity and depression
Figure 1: Real GDP per New Zealander and Australian aged 15-64, converted to 2013 price level with updated 2005 EKS purchasing power parities, 1956-2013, $US
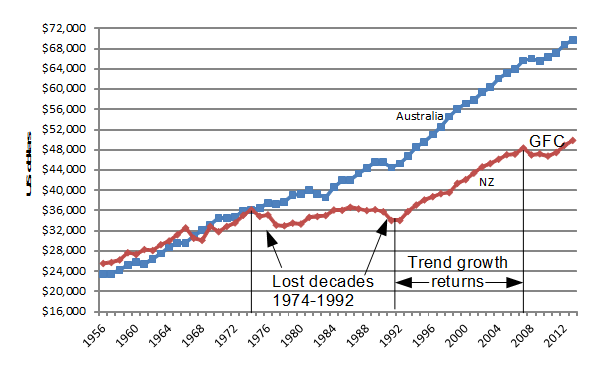
Source: Computed from OECD Stat Extract and The Conference Board, Total Database, January 2014, http://www.conference-board.org/economics
Figure 1 shows that New Zealand lost two decades of growth between 1974 and 1992 after level pegging with Australia for the preceding two decades.
New Zealand returned to trend growth between 1992 and 2007. New Zealand did not make up the lost growth of the previous two decades to catch up to Australia.
Figure 2: Real GDP per New Zealander and Australian aged 15-64, converted to 2013 price level with updated 2005 EKS purchasing power parities, 1.9 per cent detrended, base 100 = 1974, 1956-2013, $US
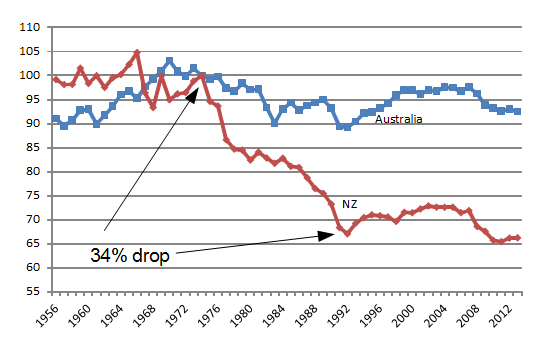
Source: Computed from OECD Stat Extract and The Conference Board, Total Database, January 2014, http://www.conference-board.org/economics
In Figure 2, a flat line equates to a 1.9% GDP annual growth rate; a falling line is a below trend growth rate; a rising line is an above 1.9% growth rate.
Figure 2 shows that there was a 34% drop against trend between 1974 and 1992; a return to trend growth and slightly better between 1992 and 2007; and then a recession to 2010.
Australia had its ups and downs since 1956 but essentially grew at the trend growth rate of 1.85% since 1970. The so-called resources boom in Australia does not show up in Figures 1 or 2.
There was no growth rebound in New Zealand to recover the lost ground, either in the lost decades between 1974 and 1992, or after the Global Financial Crisis. The strong GDP growth in Australia after that Keating recession in 1991 is an example of the country recovering lost ground after a recession – See Figure 2.
A trend growth rate of 1.9% is the 20th century trend growth rate that Edward Prescott currently estimates for the global industrial leader, which is the United States of America.
Can New Zealand blame its small size for its economic woes?
24 May 2014 Leave a comment
in geography, macroeconomics, politics - New Zealand Tags: income gap, New Zealand, relative economic performance
The median national population size is not much more than New Zealand’s current population.
- Controlling for location, Easterly and Kraay (2002) found that smaller states were richer than other states in per capita real GDP.
- Rose (2006) reviewed the impact of size on the level of income, inflation, material well-being, health, education, and the quality of a country’s institutions and found that small countries are more open to trade than large countries, but are not systematically different otherwise.
As I argued in my previous post on distance, New Zealand were prosperous from the time of European settlement despite a small population and their great distance from the main markets of the world on each side of the Atlantic.
Of the ten richest countries in terms of GDP per capita, only four have populations above one million people (Alesina 2003). These countries are the USA (290 million people), Switzerland (7 million people), Norway (4 million people) and Singapore (3 million people). Of these four nations, two are below the global national population median of six million (Alesina 2003).
New Zealand’s population is similar and often larger in size than most of the richest countries in the world. Singapore and Hong Kong were initially far from the global Trans-Atlantic economic hubs before their respective development miracles unfolded in the mid and late 20th century.
Something must have happened recently for either small population size or distance to have become important when it was not important for most of the history of New Zealand. New Zealand has been on the same place on the map for all its history.

Transport costs on exports to England and the rest of Europe did not hold back New Zealand’s economic development in the 19th century and for most of the 20th century despite far more primitive and more expensive forms of transport.
New Zealand specialised in commodities that could be produced at a low cost because land and water was plentiful and exported them in bulk to large markets on the other side of the world because of falling transport costs. The invention of refrigeration in 1881 was a major boost to meat exports to England.
The main economic difference between smaller and larger nation-states around the globe is smaller nations are more open to international trade and foreign investment (Alesina et al. 2005).
In a world of freer overseas trade, small countries can extend the size of their markets by trade and sidestep many of the costs of small internal markets. As long as political borders do not greatly limit international trade, economic success is increasingly independent of national size (Alesina 2003; Alesina et al. 2000).
A leading economic advantage of large national size in more isolationist times was a large marketplace free of trade and investment barriers and fewer national borders and different legal systems to parry. As more nations open up to the world, the single market benefits of large size for a country start to melt away quickly (Alesina 2003; Alesina and Spolaore 2003; Alesina et al. 2000).
As countries become larger, administration costs and the growing heterogeneity in the political preferences of larger and more diverse populations counterbalance the benefits of size and scale (Alesina et al. 2003, 2004, 2006; Spolaore 2006). More nation-states and freer trade increase the degree that governments must compete for citizens and investment. Inter-jurisdictional competition increases the incentives for governments to adopt institutions and policies that promote efficiency and productivity and serve their peoples better (Friedman 2005).
Can New Zealand blame distance for its economic woes?
22 May 2014 1 Comment
in economic growth, geography, macroeconomics Tags: Australia, burden of distance, New Zealand, relative productivity performance, Trans-Tasman income gap
Distance is common in many discussions of the relative growth performance of New Zealand. New Zealand is said to be small and remote and poorer for it. The figure below from a Productivity Commission report is an example.
The Productivity Commission put it this way:
New Zealand firms face reduced access to large markets and limited participation in global value chains, where the transfer of advanced technologies now often occurs.
Indeed, global value chains – which can require intensive interaction and just-in-time delivery across borders – may have worsened the impact of New Zealand’s geographic isolation on trade in goods.
The Commission continues on to say that:
These limits on trade and the diffusion of new ideas into New Zealand may explain as much as 15 percentage points of the 27% productivity gap between New Zealand and the average of 20 OECD countries.
This 15 per cent claim is a daring claim. Physical location does not change over time.
New Zealand, Australia and the other European offshoots such as Canada and the USA all prospered for most to all their histories despite their distances from their mother country. Canada cannot blame distance for its weak productivity performance because it is next door to the USA.
Figure 1 below using OECD data suggests that New Zealand and Australian real GDP per capita are both about 10 percentage points lower than they otherwise would be because of distance. A bounty of natural resources gives a less than a two per cent boost to Australia’s real GDP per capita, see Figure 1.
Figure 1: Estimated impact of proximity to markets and natural resources on real GDP per capita, OECD members, average for 2000-2004
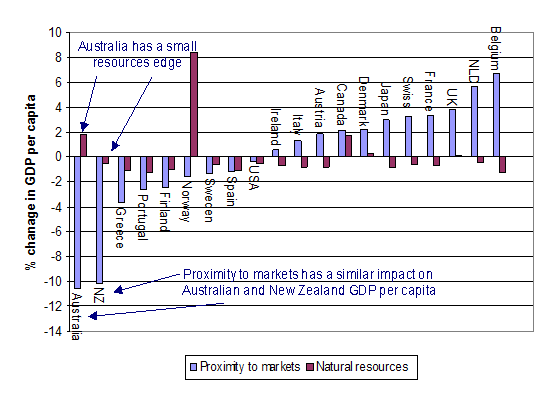
Source: OECD.
The burden of geography is about distance from large agglomerations of production, consumption and supply. There is from the extra cost of exporting to distant markets and the cost penalty from ordering from major suppliers who are far way. Geography can also affect the international flow of ideas and the diffusion of new technologies.
Figure 2 shows that most of the labour productivity gap of New Zealand and many others with the USA is not explained by geography – by access to major markets and any natural resource bounty.
Figure 2: Apparent and geography adjusted hourly labour productivity relative to the USA, 2006
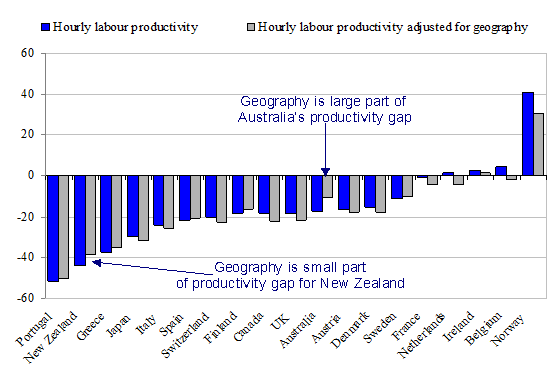
Source: OECD (2008).
New Zealand’s apparent and geography adjusted productivity gaps with the USA are not far apart. In contrast, the OECD (2009c), geography cuts in half the gap in hourly labour productivity between the USA and Australia – see Figure 3.
Figure 3: Percentage point change in hourly labour productivity relative to the USA due to geography, 2006
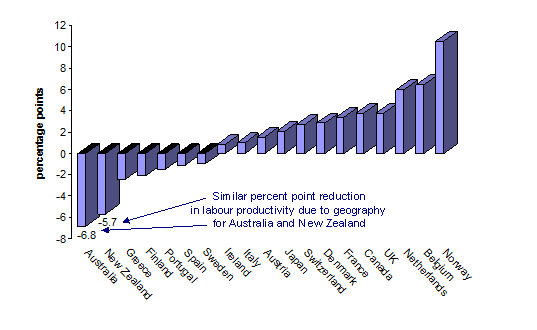
Source: OECD.
The labour productivity gap of New Zealand with the USA is over four times larger than what could be reasonably attributed to geographic burdens. Other factors must account for the bulk of New Zealand’s productivity gap.
More to the point, distance and remoteness explain none of the productivity and income gaps across the Tasman and why this gap suddenly appeared in the 1970s and 1980s to NZ’s disadvantage.
New Zealand lost almost two decades of growth between 1974 and 1992 as shown in Figure 4.
Figure 4: Real GDP per New Zealander and Australian aged 15-64, converted to 2013 price levels with updated 2005 EKS purchasing power parities, 1956-2012
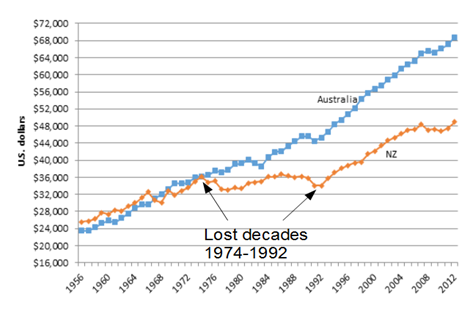
Source: Computed from OECD StatExtract and The Conference Board, Total Database, January 2014.
The Trans-Tasman gap is the income and productivity gap that concerns Kiwis and is the relevant policy yardstick everyone uses or should use.
The emergence of the Trans-Tasman income gap from initial income parity in 1974 – see Figure 4 – cannot be because of distance because both NZ and Australia suffer equally from a 10% productivity burden because of distance.
This common 10% productivity burden due to distance does not explain real GDP per working age person in Australia and NZ dropping from parity in 1974 to a 35% gap inside 20 years and then suddenly stabilising.
Figure 4 showed that NZ started growing again in 1992 after the Ruth Richardson horror budget stabilised economic policy sentiments. There was to be no going back on the economic reforms.
Figure 5 below shows that NZ’s labour productivity growth dropped like a stone between 1974 and 1992 then stabilised at 1.85% growth per year from 1992 to 2005. GDP per working age person in Figure 5 is based to 100 in 1974 and then detrended by 1.85% per year – the trend growth rate of the USA in the 20th century. A flat line in Figure 5 is annual growth in real GDP per working age person of 1.85%. Australia’s growth rate is pretty flat since 1970 bar the odd recession and recovery from the same.
Figure 5: Real GDP per New Zealander and Australian aged 15-64, converted to 2013 price levels with updated 2005 EKS purchasing power parities, base 100 in 1974, 1.85 per cent detrending, 1956-2012
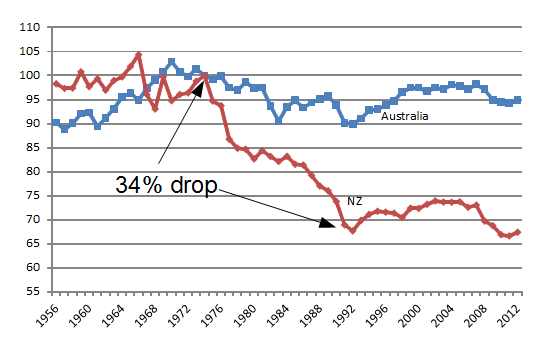
Source: Computed from OECD StatExtract and The Conference Board, Total Database, January 2014.
This 34% productivity drop in NZ from 1974 to the mid-1980s was too rapid to be explained by distance and global value chains suddenly becoming more important than was the case for most of NZ’s history. Australian GDP growth rates was not affected in the slightest by these trends in the geography of trade and input markets.
The Productivity Commission looked at the wrong data to ask the wrong questions. The data analysis undertaken on behalf of the Productivity Commission started in 1980. Figure 6 below shows at all the action and excitement regarding total factor productivity in New Zealand occurred before 1980.
Figure 6: New Zealand total factor productivity and real GDP per New Zealander aged 15-64, 2 per cent detrended, 1955-2000
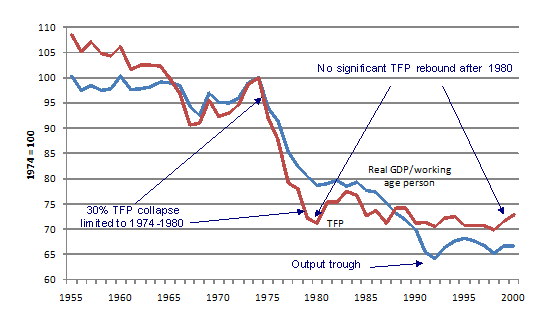
Source: Kehoe and Ruhl (2003).
Kehoe and Ruhl (2003) attributed the decline in the growth of GDP per working age New Zealander after 1974 to 1992 to a sharp decline in total factor productivity from 1974 to 1980.
Figure 6 plots detrended data constructed by Kehoe and Ruhl (2003) to show that total factor productivity fell rapidly in New Zealand between 1974 and 1980, by 30 per cent in all, and then levelled out to grow again at the trend rate of two per cent.
There was no subsequent total factor productivity recovery to make up the lost ground. If this were so, Figure 4 would have had to include a strongly rising line for total factor productivity over many years after 1980 to recover the 30 per cent fall in the level of total factor productivity between 1974 and 1980.
Kehoe and Ruhl (2003) suggested that the identification of the factors that permanently reduced total factor productivity levels in New Zealand between 1974 and 1980 may have great contemporary policy relevance.
The total factor productivity drop identified by Kehoe and Ruhl (2003) occurred before the 1978 start of the Statistics New Zealand productivity data series.
The great value of the Kehoe and Ruhl (2003) data is the drawing out of the major decline in total factor productivity on the eve of the Statistics New Zealand data series.
Kehoe and Ruhl (2003) attributed the 1970s total factor productivity collapse to a massive change in trade patterns after the entry of the UK into the then European Economic Community in 1973.
All discussions of income gaps should be against Australia and any additional burden of distance that New Zealand faces in addition to Australia since 1974 when the Trans-Tasman income gap emerged.
When New Zealand catches-up with Australia in labour productivity that will be the time to start worrying about the burden of geography – a burden that holds back relative productivity equally in both countries. You cannot explain the difference between Australia’s and NZ’s relative productivity by geographic factors they have in common.

Recent Comments