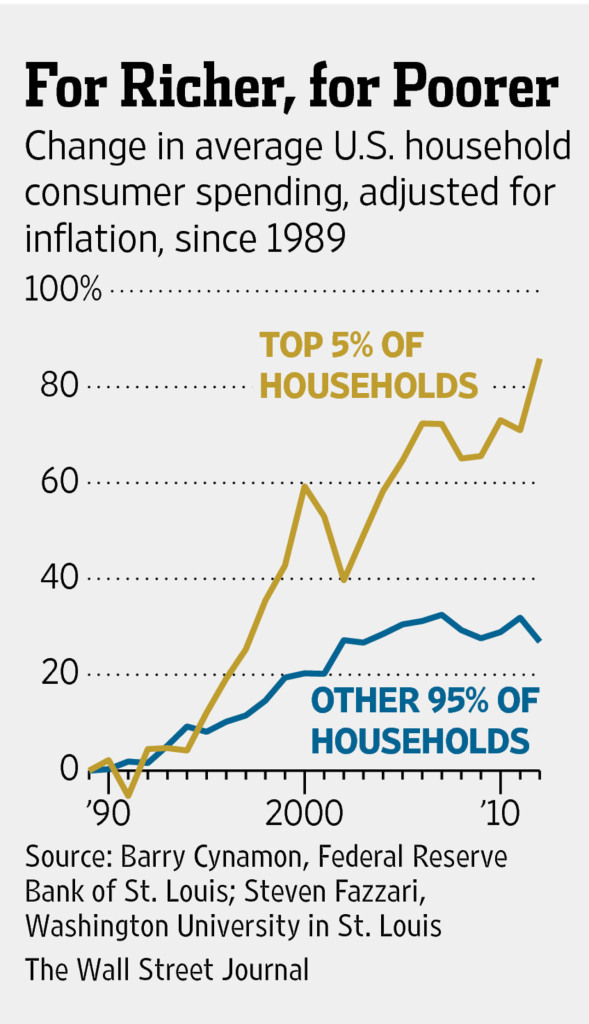
A great chart showing the large increases in average household spending adjusted for inflation over the last 25 years.
Living standards are improving when measured by household spending by the leaps and bounds over the last 25 years for everyone
As the Wall Street Journal explains,
American spending patterns after the recession underscore why many U.S. businesses are reorienting to serve higher-income households, said Barry Cynamon, of the Federal Reserve Bank of St. Louis.
Since 2009, average per household spending among the top 5% of U.S. income earners—adjusting for inflation—climbed 12% through 2012, the most recent data available. Over the same period, spending by all others fell 1% per household, according to Mr. Cynamon, a visiting scholar at the bank’s Center for Household Financial Stability, and Steven Fazzari of Washington University in St. Louis, who published their research findings last year.
The spending rebound following the recession “appears to be largely driven by the consumption at the top,” Mr. Cynamon said. He and Mr. Fazzari found the wealthiest 5% of U.S. households accounted for around 30% of consumer spending in 2012, up from 23% in 1992.
Indeed, such midtier retailers…
View original post 81 more words

Recent Comments