Revenue is a percentage of GDP has always been higher in New Zealand as compared to Australia for as far back as data is available. Tax revenue grew by a third as a percentage of GDP between 1965 and 1989 in New Zealand with a sharp spike from 1984 onwards. The growth in tax revenues as percentage of Australian GDP was smoother rather than spikes such as in the mid-1980s in New Zealand.
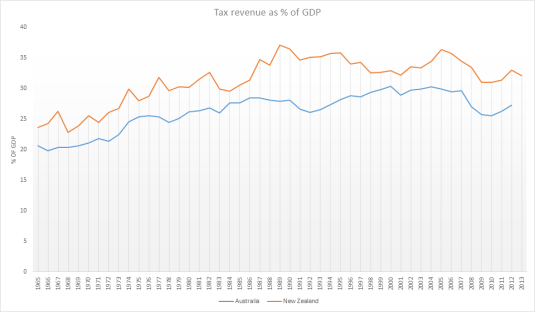
Data extracted on 18 Oct 2015 02:10 UTC (GMT) from OECD.Stat.
Interestingly, this faster growth in the New Zealand tax revenues as a percentage of GDP coincided with the two lost decades of New Zealand growth between 1974 and 1992. Furthermore, the chart below shows that an emerging recovery in labour productivity in the early 1980s stalled when tax revenues started growing again as a percentage of New Zealand GDP.
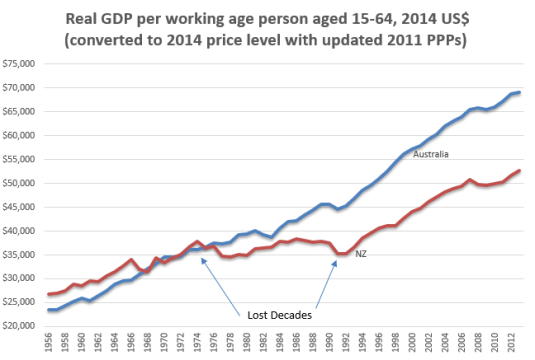
Source: Computed from OECD StatExtract and The Conference Board. 2015. The Conference Board Total Economy Database™, May 2015, http://www.conference-board.org/data/economydatabase/
Between 1974 and 1992, New Zealand lost 34% and productivity against trend of 1.9%. In the chart below, a flat line is growth at a rate equal to the trend rate of growth for the USA in the 20th century which is 1.9%. A falling line indicates growth at less than 1.9% for the year. A rising line means growth in excess of 1.9% for the year. The chart below confirms what the chart above says. Productivity stopped falling in the early 1980s then started falling rapidly at the same time that tax revenues spiked as percentage of GDP in the early 1980s.
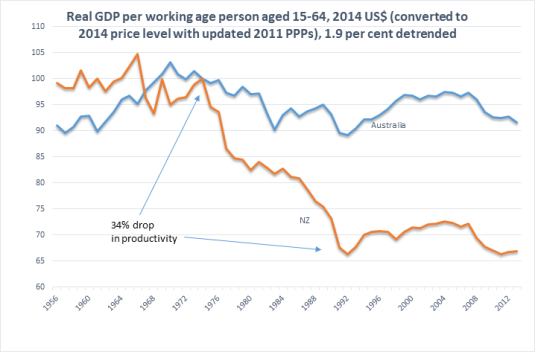
Source: Computed from OECD StatExtract and The Conference Board. 2015. The Conference Board Total Economy Database™, May 2015, http://www.conference-board.org/data/economydatabase/
in the above chart, Australia had pretty steady growth since about 1970. There is a productivity slowdown in the 1970s and above-average growth as the economy recovered from the Keating recession in the early 1990s. The so-called mining boom is hardly noticeable in Australia’s trend growth rate.

1 Comment (+add yours?)