Leading Australian academic economist John Quiggin has just published an article arguing that New Zealand should not be a policy role model for anything. To quote Quiggin:
For most of the twentieth century, the New Zealand and Australian economies performed almost identically. New Zealand took a somewhat larger hit when Britain entered the European Common Market in the 1970s, but that impact has long since washed out. The real divergence came in the 1980s. Since then, New Zealand’s income per person has fallen 35 per cent behind Australia’s
He used Reserve Bank of New Zealand data going back to 1990, which is common starting point for most Reserve Bank data.
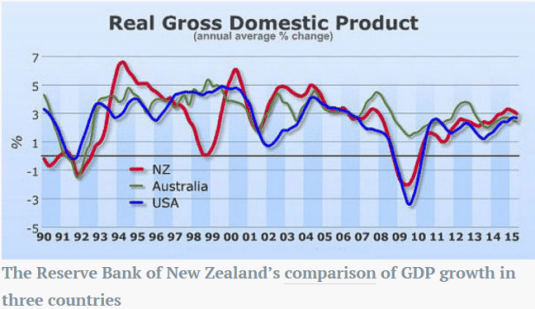
Source: John Quiggin “How New Zealand fell further behind”. Inside Story, 11 November 2015.
If he had taken that chart back to the 1970s and earlier using the Conference Board Total Database, Quiggin would have found that New Zealand economy diverged from Australia in the 1970s, not in the 1980s. His data from the Reserve Bank of New Zealand started at the low point in 1990 – at the end of that divergence that started in 1974. The New Zealand economy was depressed between 1974 and 1992. I label this Great Depression in New Zealand as New Zealand’s Lost Decades.
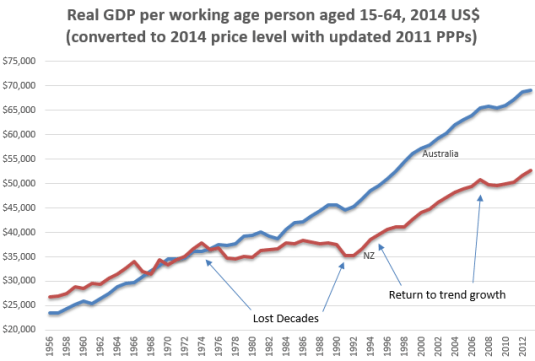
Source: Computed from OECD Stat Extract and The Conference Board. 2015. The Conference Board Total Economy Database™, May 2015, http://www.conference-board.org/data/economydatabase/
Real GDP PPP per working age New Zealander fell rapidly after 1974 (a 34% drop against trend) when that economy was a heavily regulated, highly taxed economy. This heavily regulated, highly taxed, economically stagnant New Zealand is the good old days in the eyes of the Twitter Left.
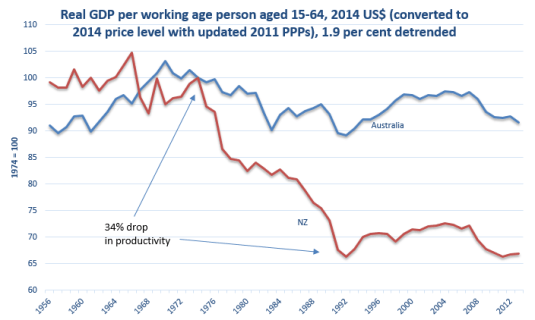
Source: Computed from OECD Stat Extract and The Conference Board. 2015. The Conference Board Total Economy Database™, May 2015, http://www.conference-board.org/data/economydatabase/
In the chart above, the base is 1974 which equals 100. A flat-line means annual growth equal to the trend rate of growth in the 20th century for the USA. A falling line means below trend growth; a rising line means above trend rate economic growth per working age Australian or New Zealander.
With the election of a National Party government in 1990 and a massive fiscal consolidation, New Zealand growth rate returned to the previous trend rate of 1.9% in 1992. Ruth Richardson’s horror budget of 1991 was so bad that the what became the Twitter Left called it the “Mother of All Budgets“.
What followed this massive fiscal consolidation where welfare benefits for cut severely was an economic boom that lasted until the GFC.
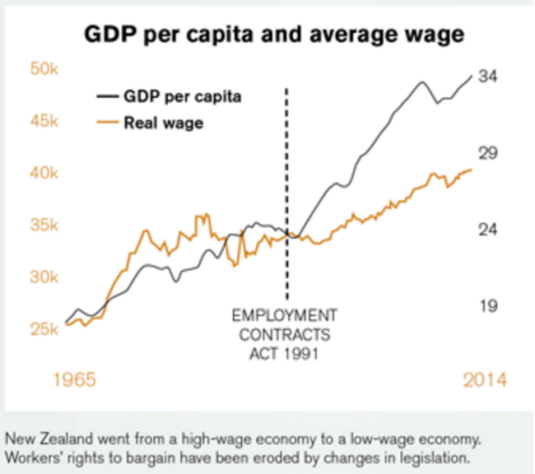
Source: Income Gap | New Zealand Council of Trade Unions – Te Kauae Kaimahi.
As shown in the chart conveniently compiled by the New Zealand Council of Trade Union, there was 20 years of real wage stagnation until the passage of the Employment Contracts Act in 1991.
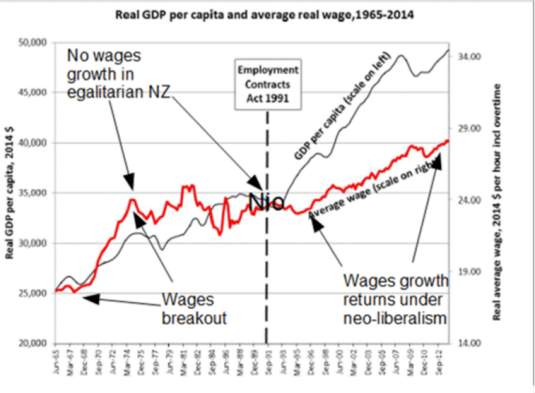
Source: Income Gap | New Zealand Council of Trade Unions – Te Kauae Kaimahi with annotations.
What followed the passage of that Act was sustained real wages growth for the first time in two decades and the end of growing inequality under the previously highly taxed, heavy regulated economy that was good old days New Zealand if the Twitter Left is to be believed.
To do this, to paint pre-1984 New Zealand, pre-neoliberal New Zealand as a fairly egalitarian paradise, Max Rashbrooke is an example of that is had to ignore two thirds of the population and the inequalities they suffered:
“New Zealand up until the 1980s was fairly egalitarian, apart from Maori and women, our increasing income gap started in the late 1980s and early 1990s,” says Rashbrooke. “These young club members are the first generation to grow up in a New Zealand really starkly divided by income.”
Racism and patriarchy can sit comfortably with a fairly egalitarian society if you are to believe the vision of the Twitter Left as to their good old days. John Quiggin refers to the period in Australia known as the Menzies Era as part of his golden age of the mixed economy. The Menzies Era was most of the 23 years of uninterrupted conservative party rule between 1949 and 1972. The actual Menzies Era was the period up to 1966 when Liberal Party Prime Minister Sir Robert Menzies retired
The reforms of the 1980s known as Rogernomics stopped the long-term stagnation in real wages that started in about 1974. The reforms of the early 1990s under a National Party government including a massive fiscal consolidation and the passing of the Employment Contracts Act was followed by the resumption of sustained growth in real wages with little interruption since.
New work by Chris Ball and John Creedy shows substantial *declines* in NZ inequality.
initiativeblog.com/2015/06/24/ine… http://t.co/f94fw4Bhae—
Eric Crampton (@EricCrampton) June 24, 2015
This boom after two decades of minimal real economic growth per working age New Zealander benefited everyone. The unemployment rate fell to a record low of 3.5% about 2005. Maori unemployment was at a 20-year low of 8% in 2008. Maori labour force participation rates increased from 45% in the late 1980s to about 62% by the eve of the Global Financial Crisis.
The increase in percentage terms of Maori and Pasifika real household income is much larger than for Pakeha since the economic reforms of the 1980s and 1990s. As Bryan Perry (2015, p. 67) explains when commenting on table D6 sourced by Closer Together Whakatata Mai:
From a longer-term perspective, all groups showed a strong rise from the low point in the mid 1990s through to 2010. In real terms, overall median household income rose 47% from 1994 to 2010: for Maori, the rise was even stronger at 68%, and for Pacific, 77%. These findings for longer- term trends are robust, even though some year on year changes may be less certain. For 2004 to 2010, the respective growth figures were 21%, 31% and 14%.

1 Comment (+add yours?)