Sometimes a picture (or a data table) does say more than a thousand words. Regardless of how you feel at the outcome, have a dispassionate look at this graph:
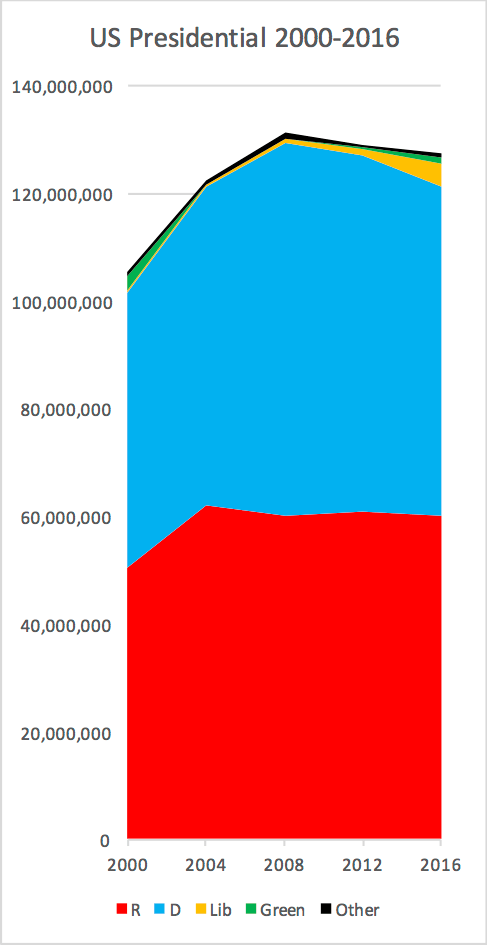
Data for 2000-2012 are from the FEC, preliminary data from 2016 from Wikipedia — the latter are subject to some change but not enough to matter at the resolution of this graph. Now focus on the stretch 2008-2016 to identify some trends:
- the GOP vote is remarkably constant over the last 3 elections
- the D vote is trending downward from the historic 2008 mark, with a sharper drop this election.
- the overall third-party vote is trending upward and increased notably this election
- overall voter participation is dropping
- From 2008 to 2016, the D party lost 8.6 million votes, while the GOP posted a small increase of 0.3 million (probably a bit more when we’ll have final numbers).
- The Libertarians, on the other hand, are…
View original post 58 more words

Recent Comments