A few days ago I posted a pic from some analysis done in Sheffield with the bold strap line of “second most important chart in contemporary health care”
Whether it IS indeed the second, third or most is probably immaterial
I was then asked for my view on the most. Others then suggested others. It’s probably impossible to suggest a “single”
Here are a few
Let me have others and I will add them to this top of the pops
Here is my take. With a line or two on each
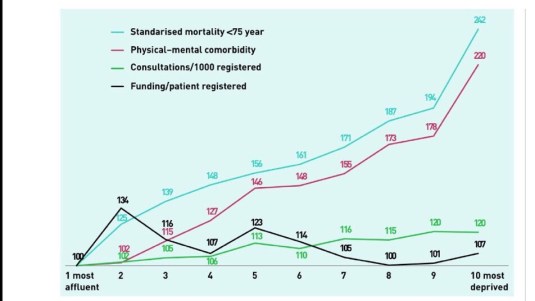
1) the jaws of doom
This is from the Scottish Deep End crew.
Demonstrates the relatively flat shape of the curve of funding per capita in primary care with steep slope of need. Important if you are making a case for equitable (not equal) distribution of resources.
2)
The fall off in historic improvements in life expectancy
This is…
View original post 129 more words

Recent Comments