Last week, I gave a presentation on the Laffer Curve to a seminar organized by the New Economic School in the nation of Georgia.
A major goal was to help students understand that you can’t figure out how changes in tax rates affect tax revenues without also figuring out how changes in tax rates affect taxable income.
As you might expect, I showed the students a visual depiction of the Laffer Curve, explaining that the government won’t collect any revenue if the tax rate is zero (the left point of the horizontal axis), but also pointing out that the government won’t collect any revenue if tax rates are 100 percent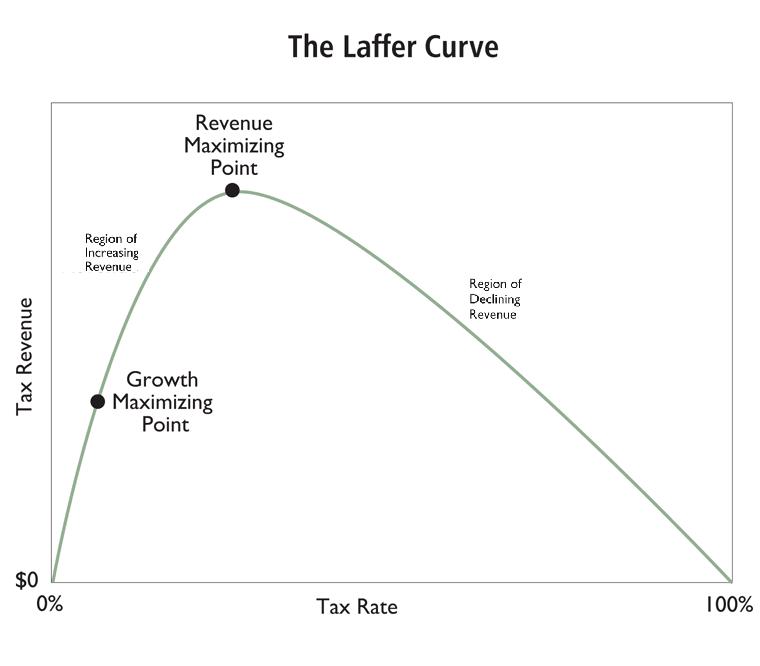 (the right point on the horizontal axis).
The curve between those two points shows how much tax is collected at various tax rates.
The upward-sloping part of the curve shows the “region of increasing revenue” (i.e., where higher tax rates…
View original post 590 more words

Recent Comments