10 Inventors Who Made Modern Life Possible
29 Jun 2016 Leave a comment
in economic history, entrepreneurship
Expansion and Decline of European Imperialism: Every Year (1492-2016)
28 Jun 2016 Leave a comment
in economic history Tags: age of empires, Age of exploration, British imperialism, maps
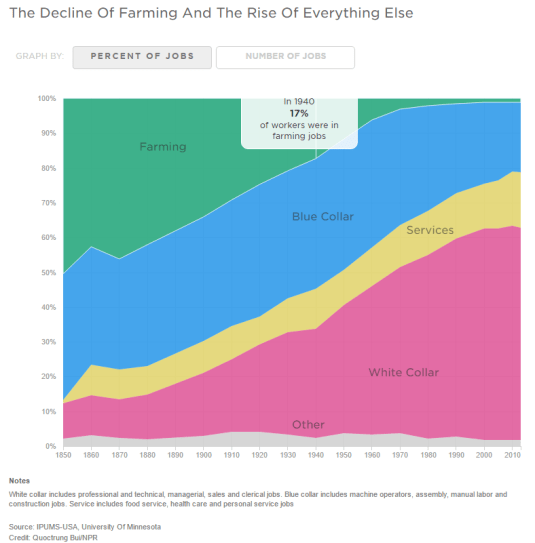
Robots came and conquered many decades ago and we survived
25 Jun 2016 Leave a comment
in economic history, labour supply
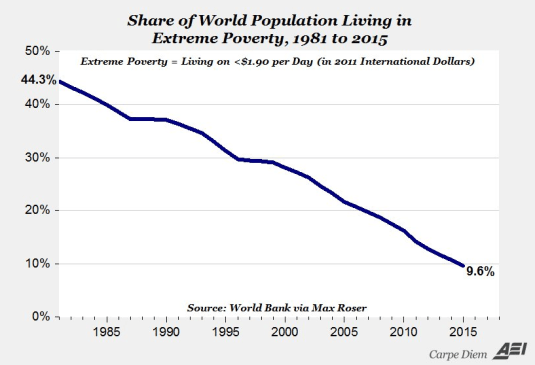
Global extreme poverty since @jeremycorbyn @BernieSanders were elected to office to fight for socialism
25 Jun 2016 Leave a comment
% difference between UK’s GDP per capita and EU founding members since 1950
25 Jun 2016 Leave a comment
in economic growth, economic history, international economics, International law
Eurosclerosis started in the 1970s while the British disease came to an end with the election of the Thatcher government so the chart paper is misleading.

Source: Britain’s EU membership: New insight from economic history | VOX, CEPR’s Policy Portal.
World population living in extreme poverty, 1820-2015
25 Jun 2016 Leave a comment
in economic history Tags: extreme poverty, global poverty, The Great Enrichment, The Great Escape, The Great Fact


Stossel – The Good New Days
23 Jun 2016 Leave a comment
in applied welfare economics, economic history Tags: pessimism bias, The Great Enrichment
Hone’s 2011 election result proved how tiny NZ far-left is @CitizenBomber @TheDailyBlogNZ
20 Jun 2016 Leave a comment
in economic history, politics - New Zealand
The dreams of electoral success live on in the New Zealand far-left despite the facts of the 2011 general election.
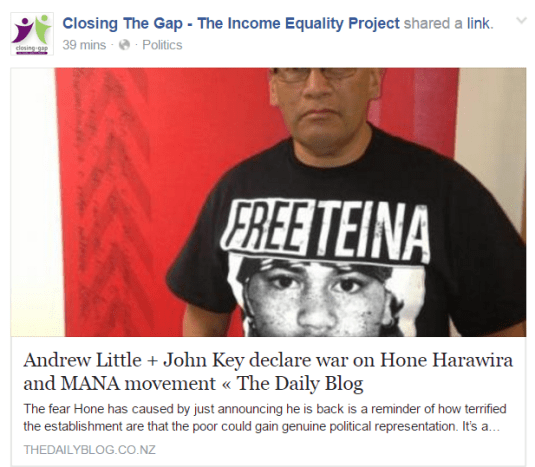
Hone Harawira is running again in the 2017 general election so the left is getting its hopes up despite his abysmal failure in the 2011 general election.
In the 2011 general election, Hone was assured of re-election therefore any party vote for him could bring in list MPs.
I was deeply surprised how badly Hone and his friends on the far left performed. His party, Mana Movement won 1.1% of the party vote. That was not enough to bring in another MP.
When the Manna Movement had millions of dollars to spend on campaigning it 1.2% of the party vote but on a lost his seat because of his association with a German billionaire facing extradition. This is why the 2011 New Zealand election is the proper test of the size of the far left vote in New Zealand.
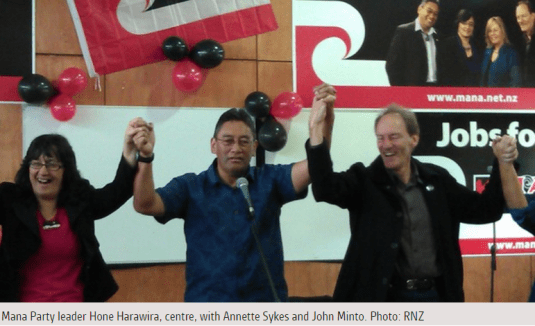
When Hone and Mana had a clean run for parliament, the hard left in New Zealand made up of him, Annette Sykes, Sue Bradford and John Minto got hardly any more votes that the people they know directly on social media and protest rallies and an assured vote from their mums.
There simply is not a far left of any size in New Zealand. Hone proved it.
Average duration of Australian, Canadian and American male unemployment, aged 25 to 54
20 Jun 2016 Leave a comment
in economic history, labour economics, labour supply, unemployment Tags: social insurance, unemployment benefit

Why the British and Americans have different accents?
19 Jun 2016 Leave a comment
in economic history Tags: economics of languages, network goods
What did Rogernomics do? @CloserTogether @FairnessNZ @WJRosenbergCTU
19 Jun 2016 Leave a comment
in economic history, politics - New Zealand
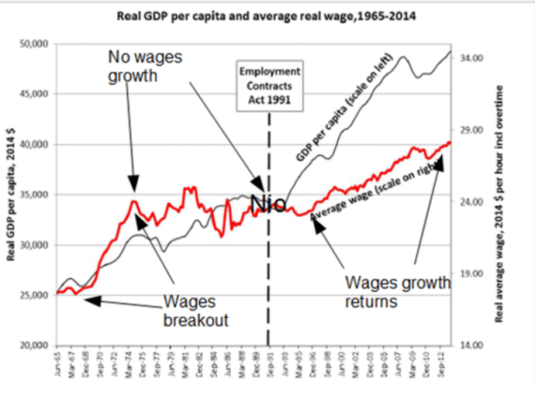
Source: Low Wage Economy | New Zealand Council of Trade Unions – Te Kauae Kaimahi, with annotations by this blogger.
@CloserTogether shows everyone in #NewZealand is much better off
19 Jun 2016 Leave a comment
in applied welfare economics, economic history, politics - New Zealand, public economics
The chart below by poverty and inequality activists shows that Europeans, Maori and Pacifika are all much better off since 1988.
The increase in percentage terms for Maori and Pasifika household incomes is much larger than for Europeans as Bryan Perry (2015, p. 67) explains when commenting on table D6 sourced by Closer Together Whakatata Mai:
From a longer-term perspective, all groups showed a strong rise from the low point in the mid-1990s through to 2010. In real terms, overall median household income rose 47% from 1994 to 2010; for Maori, the rise was even stronger at 68%, and for Pacific, 77%. These findings for longer- term trends are robust, even though some year on year changes may be less certain. For 2004 to 2010, the respective growth figures were 21%, 31% and 14%.
The reforms of the 1980s known as Rogernomics stopped the long-term stagnation in real wages that started in about 1974 as the Facebook linked chart below shows.
The reforms of the early 1990s under a National Party government including a massive fiscal consolidation and the passing of the Employment Contracts Act was followed by the resumption of sustained growth in real wages with little interruption since. The good old days was long-term stagnation in wages. These economic reforms in the 1980s and 1990s also lead to a substantial decline in inequality.
New work by Chris Ball and John Creedy shows substantial *declines* in NZ inequality.
initiativeblog.com/2015/06/24/ine… http://t.co/f94fw4Bhae—
Eric Crampton (@EricCrampton) June 24, 2015
The wage stagnation in New Zealand in the 1970s and early 80s coincided with a decline in the incomes of the top 10%. When their income share started growing again for a short time in the 1980s, so did the wages of everybody after 20 years of stagnation.
The top 10% in New Zealand managed to restore their income share of the early 1970s and indeed the 1960s. That it is hardly the rich getting richer.
To paint pre-1984 New Zealand, pre-neoliberal New Zealand as an egalitarian paradise, as one of the most equal countries in the world, the Closer Together tweet and Max Rashbrooke both had to ignore 60% of the population and the inequalities they suffered.
“New Zealand up until the 1980s was fairly egalitarian, apart from Maori and women, our increasing income gap started in the late 1980s and early 1990s,” says Rashbrooke. “These young club members are the first generation to grow up in a New Zealand really starkly divided by income.”
Racism and patriarchy can sit comfortably with a fairly egalitarian society if you are to believe the Twitter Left. The biggest beneficiaries of the return of wages growth were Maori and New Zealand women. The gender wage gap in New Zealand is the smallest in the OECD.
Perry (2014) reviews the poverty and inequality data in New Zealand every year for the Ministry of Social Development. He concluded that:
Overall, there is no evidence of any sustained rise or fall in inequality in the last two decades. The level of household disposable income inequality in New Zealand is a little above the OECD median. The share of total income received by the top 1% of individuals is at the low end of the OECD rankings.

Recent Comments