
What will happen if asteroids hit Earth
13 Jan 2017 1 Comment
in economics of natural disasters Tags: space
How Big do Tsunamis Get?
11 Jan 2017 Leave a comment
in economics of natural disasters Tags: Tsunami
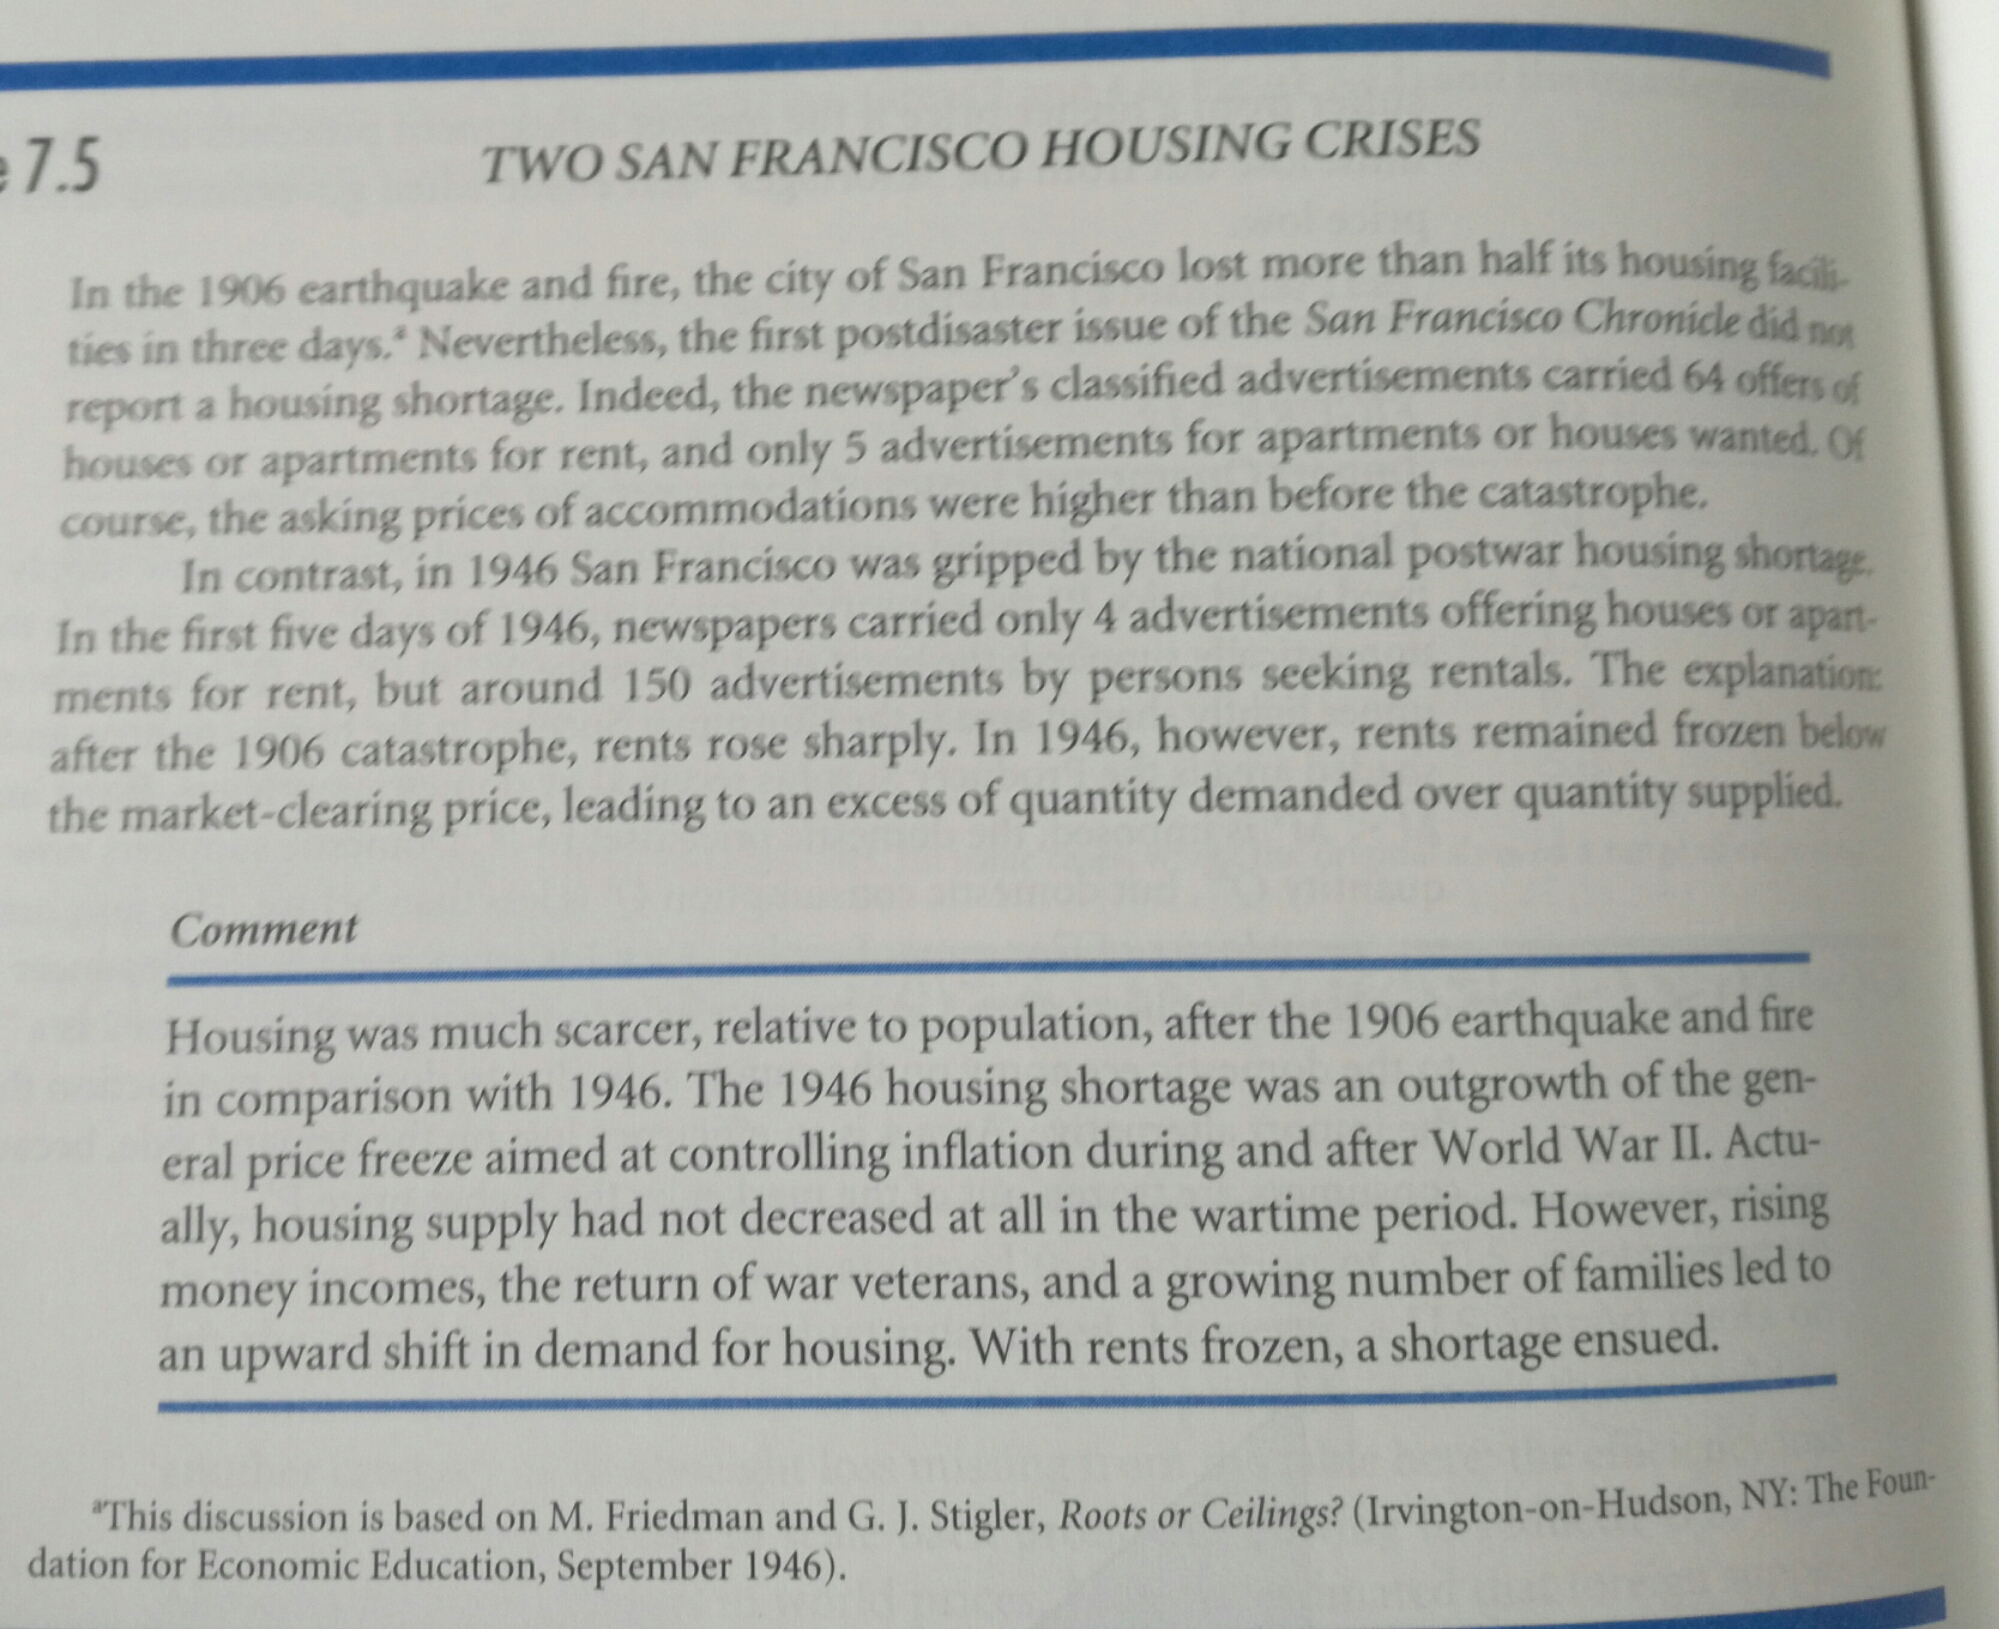
Thinking of rent control?
10 Jan 2017 Leave a comment
in applied price theory, economic history, economics of natural disasters, economics of regulation, Milton Friedman Tags: george stigler, rent control
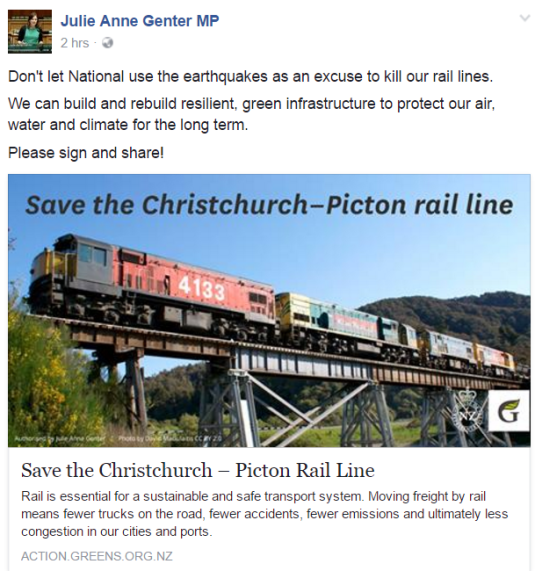
Hard rock: the challenge of the Awatere Valley Road slip
19 Dec 2016 Leave a comment
in economics of natural disasters, transport economics Tags: earthquakes

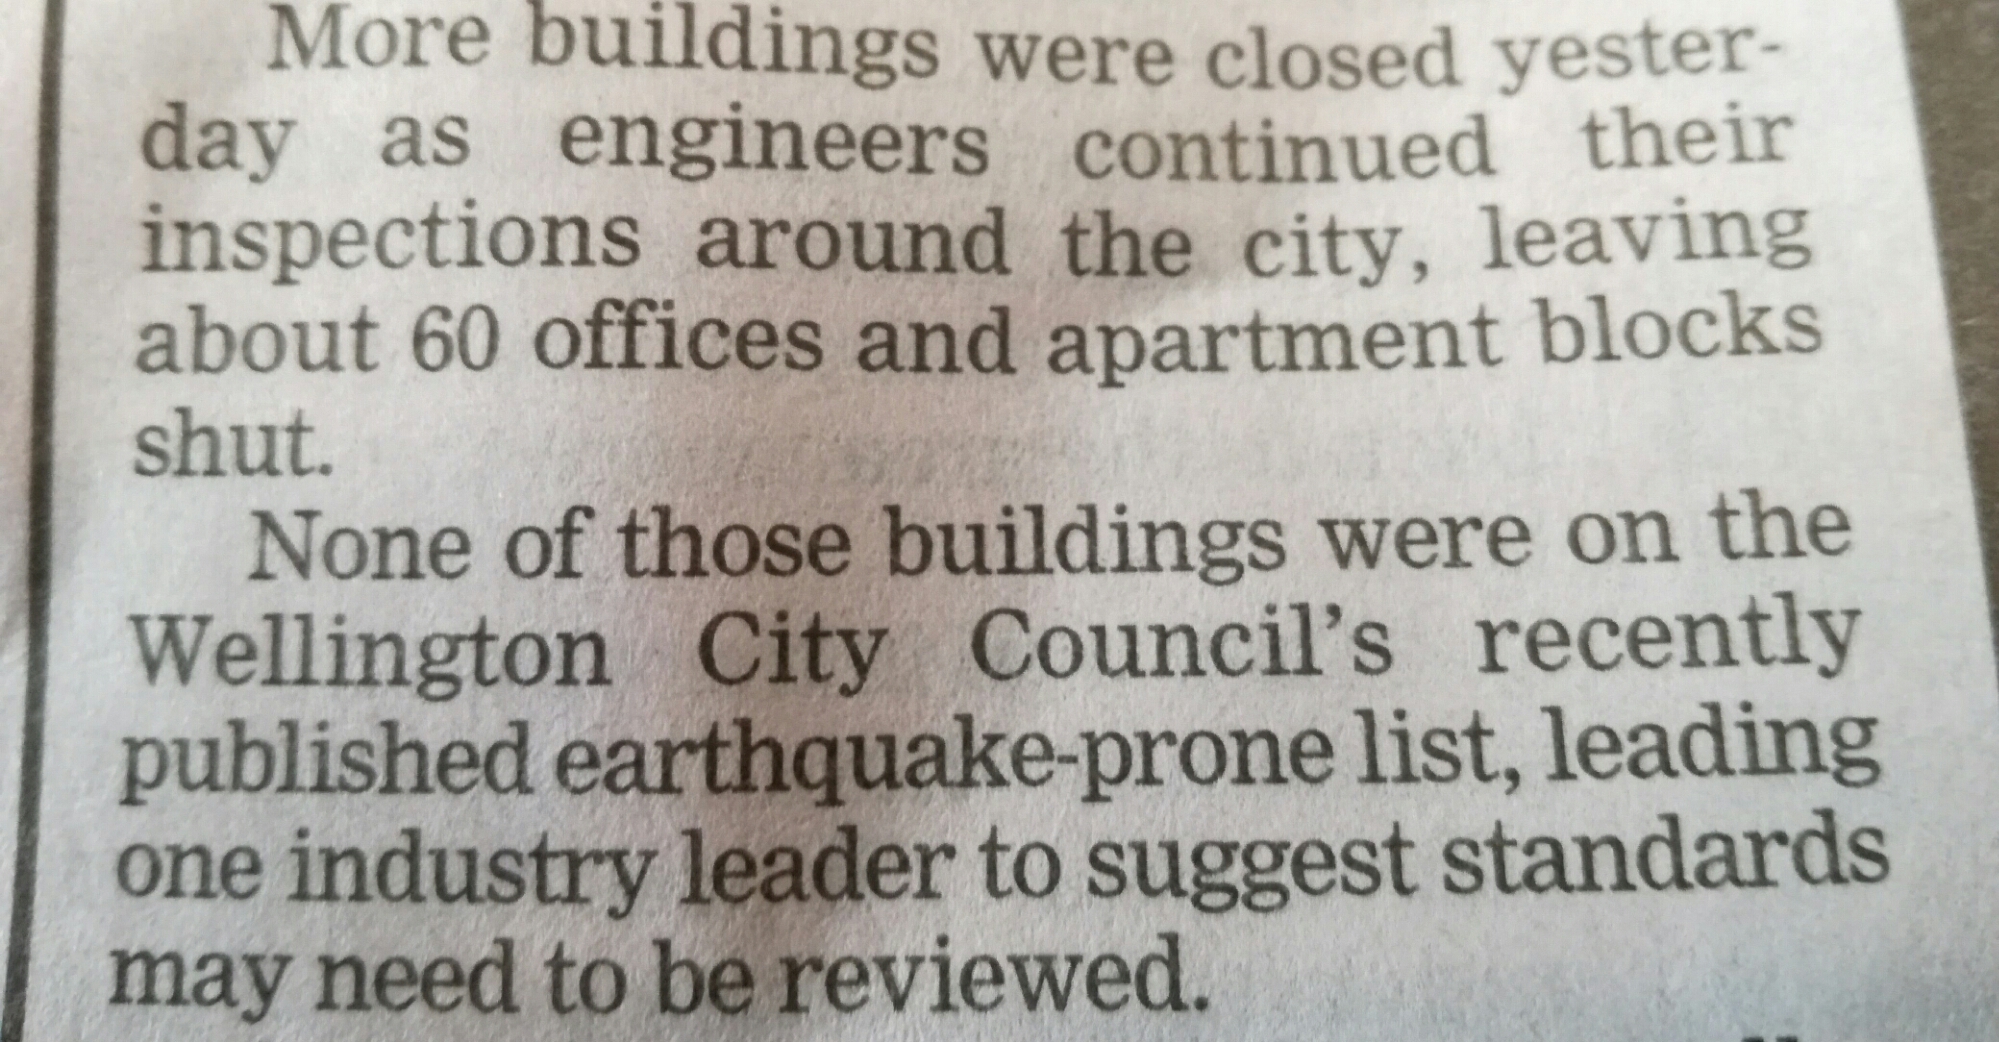
Earthquakes + Engineering – Normal People Edition
25 Nov 2016 Leave a comment
in economics of natural disasters
M7.8 Kaikoura Earthquake computer simulation
23 Nov 2016 Leave a comment
in economics of natural disasters
Kaikoura Earthquake: Papatea Fault Drone flyover
22 Nov 2016 Leave a comment
in economics of natural disasters
Kaikoura earthquake and aftershocks – 8 days on
22 Nov 2016 Leave a comment
in economics of natural disasters
The varying risk of tsunamis around the world
19 Nov 2016 Leave a comment
Map showing the varying risk of tsunamis around the world tsunami-alarm-system.com/fileadmin/medi… http://t.co/hFMIU7MucN—
Beautiful Maps (@BeautifulMaps) September 10, 2015

Recent Comments