

Celebrating humanity's flourishing through the spread of capitalism and the rule of law
20 Jan 2015 Leave a comment
in human capital, labour economics Tags: age of human capital, income inequality, wealth inequality
20 Jan 2015 Leave a comment
in applied welfare economics, politics - New Zealand, poverty and inequality Tags: Gini coefficient, poverty and inequality, top 1%
| Has the dispersion of earnings been increasing in recent decades? | Yes, the top decile has risen from 143 per cent of median in 1986 to 186 per cent in 2012. |
| Has overall inequality increased in recent years? | No, the Gini coefficient has been relatively stable around 32 percent since 1996. However, it rose by 7 percentage points between 1988 and 1996. |
| Have there been periods when overall inequality fell for a sustained period? | Yes, from mid-1950s to mid-1970s. |
| Has poverty been falling or rising in recent decades? | Poverty has substantially increased from 1996 to 2004 before decreasing mildly till 2009. |
| Has there been a U-pattern for top income shares over time? | Yes, top gross income shares fell from mid-1950s to mid-1980s, then rose from mid-1980s to mid-1990s. |
| Has the distribution of wealth followed the same pattern as income? | Insufficient evidence. |
| Additional noteworthy features | U-shape over post-war period. Top income shares estimates for the years 1998, 1999 and 2000 are affected by changes in the income tax laws. Top shares series have a break in 1951 (change in tax units). |

You are welcome to share but please refer to A. B. Atkinson and S. Morelli (2014) – ‘The Chartbook of Economic Inequality’ at http://www.ChartbookOfEconomicInequality.com
This visualisation is licensed under a Creative Commons BY-NC-SA license Data visualisation by: Max Roser
19 Jan 2015 Leave a comment
in discrimination, gender, human capital, labour supply, occupational choice, population economics Tags: gender wage gap, Parental leave, unintended consequences
19 Jan 2015 Leave a comment
in global financial crisis (GFC), great recession, labour economics, labour supply, macroeconomics, unemployment Tags: jobless recovery
18 Jan 2015 1 Comment
in applied welfare economics, economic history, gender, labour economics, Marxist economics
Max Rashbrooke is at it again in today’s Sunday Star Times – Wellington’s Sunday paper. He was painting pre-economic reform, pre-1984 New Zealand is a golden era of egalitarianism.

To do this, to paint pre-1984 New Zealand, pre-neoliberal New Zealand as a fairly egalitarian paradise, he only had to ignore up to two thirds of the population and the inequalities they suffered.
“New Zealand up until the 1980s was fairly egalitarian, apart from Maori and women, our increasing income gap started in the late 1980s and early 1990s,” says Rashbrooke. “These young club members are the first generation to grow up in a New Zealand really starkly divided by income.”
Racism and patriarchy can sit comfortably with a fairly egalitarian society if you are to believe the Left over Left.
As he implies in the paper today, captioned and quoted above, New Zealand in the 1980s was not fairly egalitarian for women, the majority of the population, and Māori, another 10% or so of the population.
This ignoring of racial and gender equality is very much in keeping with Max Rashbrooke’s boy’s own view of egalitarianism: women and ethnic minorities such as Māori and Pasifika don’t count in the greater scheme of the Left over Left when they whine and bitch about the Great Enrichment.
The mission in life of the Left over Left is desperately seeking poverty even if they drop out of the statistics most of the people who are no longer in poverty because of the Great Enrichment and the latest blessings of capitalism and freedom.
As shown in figure 1 below, between 1994 and 2010, real equivalised median New Zealand household income rose by 47%; for Māori, this rise was 68%; for Pasifika, the rise in real equivalised median household income was 77%.
Figure 1: Real equivalised median household income (before housing costs) by ethnicity, 1988 to 2013 ($2013)

Source: Bryan Perry, Household incomes in New Zealand: Trends in indicators of inequality and hardship 1982 to 2013. Ministry of Social Development (July 2014).
Median household income increases of nearly 50% in 16 years, and larger increases for ethnic minorities such as Māori and Pasifika should be celebrated rather than simply ignored because they are inconvenient to Left over Left sniping.

As is common with every member of the Left over Left that I run into these days, such as Max Rashbrooke,, their analysis has no gender analysis.
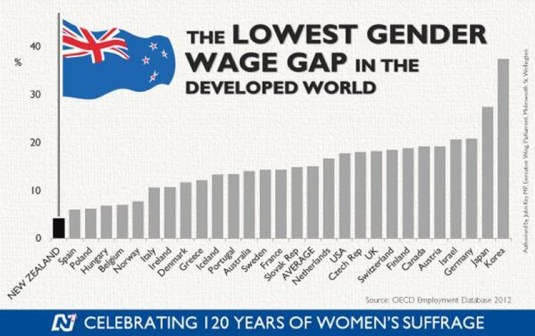
The Left over Left invariably fail to mention that New Zealand has the smallest gender wage gap of all the industrialised countries.
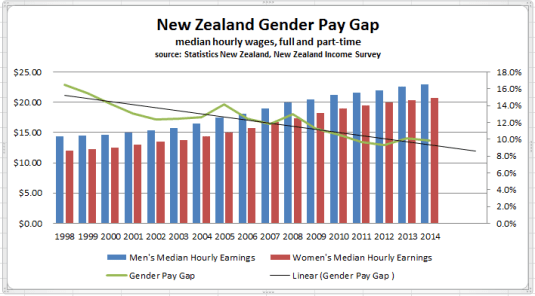
Sources: Ministry of Women’s Affairs and Statistics New Zealand: New Zealand Income Survey
Over the last more than two decades in New Zealand, there has been sustained income growth spread across all of New Zealand society contrary to hopes and dreams of the Left over Left.
Perry (2014) reviews the poverty and inequality data in New Zealand every year for the Ministry of Social Development. He concluded that:
Overall, there is no evidence of any sustained rise or fall in inequality in the last two decades. The level of household disposable income inequality in New Zealand is a little above the OECD median. The share of total income received by the top 1% of individuals is at the low end of the OECD rankings
18 Jan 2015 Leave a comment
in labour economics, politics - Australia, politics - New Zealand, politics - USA Tags: single parenthood
17 Jan 2015 Leave a comment
in occupational choice, personnel economics Tags: health and safety
17 Jan 2015 Leave a comment
in economic growth, Gary Becker, human capital, job search and matching, labour economics, occupational choice Tags: human capital externalities
While there is a vast literature documenting the large private returns from education and on-the-job human capital (Card 1999; Rubenstein and Weiss 2007; Almeida and Carneiro 2008), evidence of human capital spillovers is limited. Many studies find little evidence of spillovers from education (Lange and Topel (2005), Ciccone and Peri (2006)). Studies even struggle to find small spillovers from another year in high school (Acemoglu and Angrist 2001). Differences in human capital also explain only a small part of cross-national differences in incomes per capita (Hsieh and Klenow 2010; Parente and Prescott 2000, 2005).

The R&D industries offer a case study of the likely size of skills spillovers from worker mobility from large firms. The mobility of technical personnel and the human capital embodied in them across R&D firms is a substantial source of knowledge transfer (Møen 2005). For there to be a spillover, the new employer must pay recruits less than the value added by the job experience and skills they bring to the fold.
A key advantage of studying the mobility of R&D workers for skills spillovers is these industries are populated with many spin-offs founded by the ex-employees of larger firms. R&D spin-offs tend to be larger on average that other new firms and initially employ more advanced, more experienced workers and more technical specialists than do other new firms (Andersson and Klepper 2013).

Capturing the value of skills spillovers from job-hopping is a major business opportunity. The efforts of entrepreneurs to create and enforce property rights over information and other resources as their value increases are central to the organisation of both markets and firms.
A litmus test for the capture of the value of skills spillover is whether wages adjust in line with evolving career opportunities. Becker (2007, p. 134) explains this process of market adaptation and entrepreneurship as follows:
Firms introducing innovations are alleged to be forced to share their knowledge with competitors through the bidding away of employees who are privy to their secrets. This may well be a common practice, but if employees benefit from access to saleable information about secrets, they would be willing to work more cheaply than otherwise.
Møen (2005), Magnani (2006) and Maliranta, Mohnen and Rouvinen (2009) found that employers capture much of the skills spillovers to others by paying R&D workers less early in their careers; later employers pay higher wages to reflect the valued added by the human capital that these R&D recruits bring.

Andersson, Freedman, Haltiwanger, Lane and Shaw (2009) found that software firms in markets with large returns from product breakthroughs pay higher starting salaries to attract star employees. Accounting and legal firms and sports teams also pay more to recruit and retain top performers (Wezel, Cattini and Pennings 2006; Campbell, Ganco, Franco and Agarwal 2012; Rosen 2001).
Employers balance skills and knowledge acquisition through recruitment with in-house development of skills and knowledge. Mason and Nohara (2010) did not find ‘any evidence’ that the external experience of scientists and engineers is any more valuable to firms than is their internal experience.
Firms will pay a wage that equalises the returns on skills acquisition through recruitment with the returns on investing in in-house training. This equalisation of the returns between internal and external sources of skills and knowledge is consistent with competition penalising firms that pay too much or too little for inputs and rewarding entrepreneurs for superior alertness to new opportunities.
The option value of founding or working for a spin-off is also captured in the wages of R&D workers (Kitch 1980; Pakes and Nitzan 1983). Central to a spin-off is carrying on with new ideas and prototypes that the leaving employees judged to be under-valued by the parent firm and they want to build on at their own entrepreneurial risk (Klepper and Sleeper 2005; Klepper 2007).
Large firms are known for incremental innovations while small firms pioneer product break-troughs whose prospects were not as well valued inside large hierarchies (Baumol 2002, 2005; Audretsch and Thurik 2003). Many R&D spin-offs continue with emerging ideas and products that their parents were in the process of abandoning (Hellmann 2007; Chatetterjee and Rossi-Hansberg 2012; Klepper and Thompson 2010). One reason is the developing idea does not fit in with the risk profile and skills of the parent so many spin-offs are friendly (Fallick, Fleischman, and Rebitzer 2006; Chen and Thompson 2011).
Founding or working for a spin-off or start-up is a real prospect. In many innovative industries, upwards of 20 percent of new entrants are intra-industry spinoffs; these firms outperform other new entrants and disproportionately populate the ranks of industry leaders (Klepper and Thompson 2010).
The evidence of large firms spawning more entrepreneurs among scientists and engineers is mixed. Large parent firm size reduces both the probability of leaving, and more so, the probability of leaving to found a spin-off (Andersson and Klepper 2013; Sørensen 2007; Sørensen and Philipps 2011). Spin-offs are less likely from large parents because more of the skills and experience accumulated within large firms is firm-specific human capital and is therefore less mobile into a spin-off.
Scientists and engineers who worked in small firms are ‘far more likely’ to found a spin-off than are their large firm counterparts, and their spin-offs are more likely to be a success (Elfenbein, Hamilton and Zenger 2010; Sørensen and Phillips 2011). Working in smaller firms allows spin-off minded employees to gain the balance and wide array of technical knowledge and management skills that are prized in entrepreneurship (Elfenbein, Hamilton and Zenger 2010; Lazear 2004, 2005).
Working in managerial hierarchies works against founding a spin-off. Tåg, Åstebro and Thompson (2013) found that conditional on size, employees in firms with more layers of management are less likely to enter entrepreneurship, self-employing or quit to go to another firm. They attributed this to the employees in firms with fewer management layers developing a broader range of skills; multiple layers of management offering more promotion opportunities; and skill mismatch is less problematic in more hierarchical firms because there are more chances to move. The higher pay and better career opportunities in larger firms reduces job quits, and with it, skills spillovers and spin-offs.
The wage adjustments for current skills and knowledge transfer opportunities to future employers, start-ups and spin-offs are large. New science graduates accept 20 per cent less in starting pay to work where they can publish more in their own names (Stern 2004).

Scientists and engineers working in R&D accept 20 per cent less pay than other scientists and engineers who work in technical and managerial occupations to secure this more interesting work (Dupuy and Smits 2010). Gibbs (2006) suggested that the U.S. Department of Defense is able to recruit and retain engineers and scientists on low pay because they offer work on some of the most advanced technical research in the world.
Employers who pay full value in wages, share options, learning and R&D opportunities in exchange for the labour and human capital of employees are not benefiting from a skills spillover.

The evidence just reviewed identifies market processes that minimise skills spillovers from large R&D firms to spin-offs. Large firms train their employees in skills that are more often firm-specific and adjust wages to account for the career opportunities that might arise from on-the-job training that is more mobile. The employees of larger firms have longer job tenures in part because their human capital is less mobile.
16 Jan 2015 Leave a comment
in economics of media and culture, Marxist economics, occupational choice, politics - USA Tags: media bias
These graphs show the contributions by individual donors in each industry to political candidates


via http://blog.crowdpac.com/post/101785128940/the-political-bias-of-each-profession
A History of the Alt-Right
Econ Prof at George Mason University, Economic Historian, Québécois
Celebrating humanity's flourishing through the spread of capitalism and the rule of law
Scholarly commentary on law, economics, and more
Beatrice Cherrier's blog
Celebrating humanity's flourishing through the spread of capitalism and the rule of law
Celebrating humanity's flourishing through the spread of capitalism and the rule of law
Celebrating humanity's flourishing through the spread of capitalism and the rule of law
Why Evolution is True is a blog written by Jerry Coyne, centered on evolution and biology but also dealing with diverse topics like politics, culture, and cats.
Celebrating humanity's flourishing through the spread of capitalism and the rule of law
Celebrating humanity's flourishing through the spread of capitalism and the rule of law
A rural perspective with a blue tint by Ele Ludemann
DPF's Kiwiblog - Fomenting Happy Mischief since 2003
Celebrating humanity's flourishing through the spread of capitalism and the rule of law
The world's most viewed site on global warming and climate change
Tim Harding's writings on rationality, informal logic and skepticism
A window into Doc Freiberger's library
Let's examine hard decisions!
Commentary on monetary policy in the spirit of R. G. Hawtrey
Thoughts on public policy and the media
Celebrating humanity's flourishing through the spread of capitalism and the rule of law
Politics and the economy
A blog (primarily) on Canadian and Commonwealth political history and institutions
Reading between the lines, and underneath the hype.
Economics, and such stuff as dreams are made on
"The British constitution has always been puzzling, and always will be." --Queen Elizabeth II
Celebrating humanity's flourishing through the spread of capitalism and the rule of law
Celebrating humanity's flourishing through the spread of capitalism and the rule of law
WORLD WAR II, MUSIC, HISTORY, HOLOCAUST
Undisciplined scholar, recovering academic
Celebrating humanity's flourishing through the spread of capitalism and the rule of law
Res ipsa loquitur - The thing itself speaks
In Hume’s spirit, I will attempt to serve as an ambassador from my world of economics, and help in “finding topics of conversation fit for the entertainment of rational creatures.”
Researching the House of Commons, 1832-1868
Articles and research from the History of Parliament Trust
Reflections on books and art
Posts on the History of Law, Crime, and Justice
Celebrating humanity's flourishing through the spread of capitalism and the rule of law
Exploring the Monarchs of Europe
Cutting edge science you can dice with
Small Steps Toward A Much Better World
“We do not believe any group of men adequate enough or wise enough to operate without scrutiny or without criticism. We know that the only way to avoid error is to detect it, that the only way to detect it is to be free to inquire. We know that in secrecy error undetected will flourish and subvert”. - J Robert Oppenheimer.
The truth about the great wind power fraud - we're not here to debate the wind industry, we're here to destroy it.
Celebrating humanity's flourishing through the spread of capitalism and the rule of law
Celebrating humanity's flourishing through the spread of capitalism and the rule of law


Recent Comments