Data Mining: How You’re Revealing More Than You Think
16 Jul 2018 Leave a comment
in econometerics, economics of information, entrepreneurship Tags: data mining
Admitting to the problem is progress
28 Dec 2017 Leave a comment
in econometerics Tags: data mining, Psychology
Why do they always use 1979 as a reference point?
31 Aug 2016 Leave a comment
in environmental economics, global warming Tags: climate alarmism, data mining, global warming, logical fallacies

Some basics about opinion polls and polling results
03 Aug 2015 Leave a comment
in applied price theory, econometerics, Public Choice Tags: data mining, media bias, opinion polls, sampling errors, statistics, voter demographics
Common mistakes in polling and poll results, from PhD Comics…. phdcomics.com/comics.php http://t.co/JIvuPqFVRs—
(@SocImages) August 02, 2015
All have same mean, variance, correlation, & regression line
21 Jun 2015 Leave a comment
in econometerics Tags: data mining
All have same mean, variance, correlation, & regression line. Lesson: Always Visualize Data. bit.ly/1y3MMju http://t.co/YZ8M4mqhif—
Cliff Pickover (@pickover) May 05, 2015
Science is often flawed. Here is how.
14 May 2015 Leave a comment
in economics of bureaucracy, organisational economics, personnel economics Tags: data mining, philosophy of science, publish or perish

Academic jargon decoded
06 May 2015 Leave a comment
in economics of education Tags: academic jargon, data mining, philosophy of science, public intellectuals
What academics are really saying http://t.co/e5E4H0YRqf—
Conrad Hackett (@conradhackett) February 14, 2015
Persuasive power of quoting a number
29 Apr 2015 Leave a comment
in applied price theory, applied welfare economics, behavioural economics, econometerics, economic history, economics of information Tags: cognitive biases, cognitive psychology, data mining, economics of persuasion, evidence-based policy
Politicians & statistics. My proposal in today's @FT : ft.com/cms/s/0/dcf46a… http://t.co/HYbV4V2ps2—
Jonathan Portes (@jdportes) January 26, 2015


Examples of Spurious Relationships
17 Jun 2014 2 Comments
in econometerics, economics Tags: data mining, spurious relationships
| Observed Spurious Relationship | Reason for Relationship (the Third Variable) |
| Amount of ice cream sold and deaths by drownings (Moore, 1993) | Season: Ice cream sales and drownings tend to be high during the warm months of the year |
| Ministers’ salaries and price of vodka | Area (i.e., urban or rural): In urban areas, prices and salaries tend to be higher. |
| Shoe size and reading performance for elementary school children | Age: Older children have larger shoe sizes and read better. |
| Number of doctors in region and number of people dying from disease | Population density: In highly dense areas, there are more doctors and more people die. |
| Number of doctors in region and number of people dying from disease | Population density: In highly dense areas, there are more police officers and more crimes. |
| Number of police officers and number of crimes (Glass & Hopkins, 1996) | Population density: In highly dense areas, there are more homicides and more churches. |
| Number of homicides and number of churches | Time: Both variables were increasing over time |
| Number of storks sighted and the population of Oldenburg, Germany, over a six-year period (Box, Hunter, & Hunter, 1978) | Time: Both were increasing during the 1970s. |
| Number of public libraries and the amount of drug use | Time: Both tend to increase over time. |
| Teachers’ salaries and the price of liquor (Moore and McCabe, 1993) | Time: Both tend to increase over time. |
| Tea drinking and lung cancer | Smoking: Tea drinkers have a lower risk only because they smoke less |
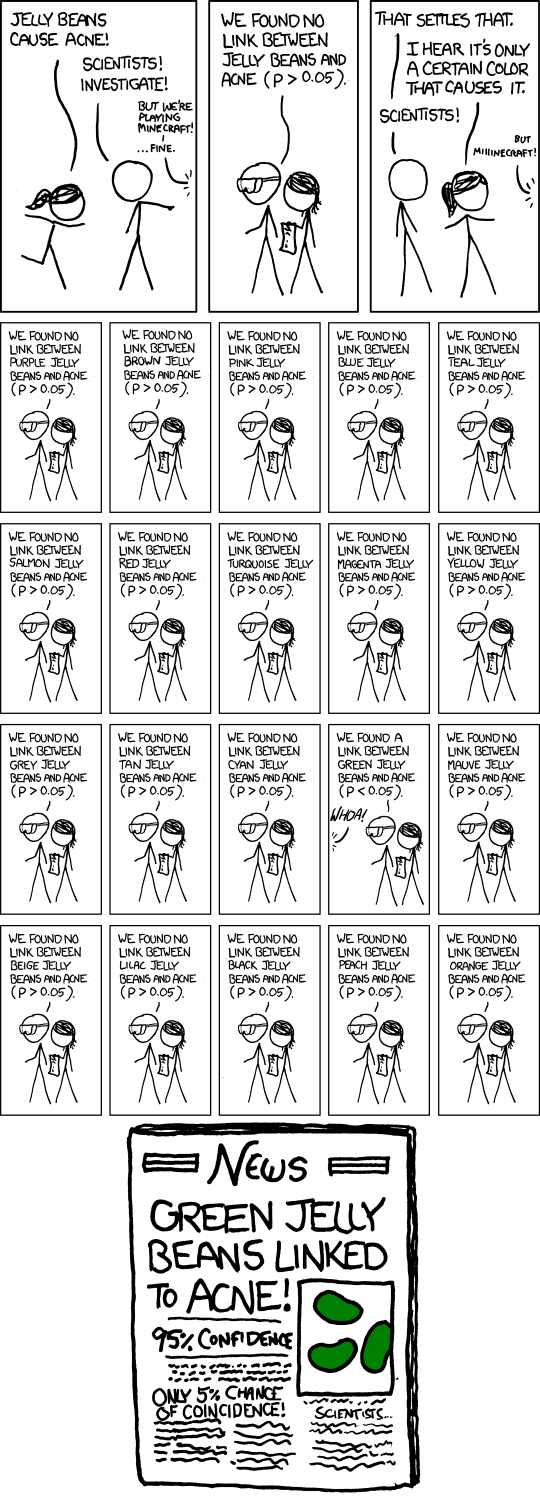
Halpern (2003) identified correlations that are often used to erroneously infer causality: illusory correlations, spurious correlations, and accidental correlations.
Illusory correlations are based on an individual’s preconceived notions or beliefs which lead one to look for associations between variables that confirm those.
Accidental correlations have no logical connection between them.
Finally, spurious correlations are correlations between two variables that are actually caused by a third variable.

The Spirit Level
07 Jun 2014 Leave a comment
in applied welfare economics Tags: data mining, income inequality, Spirit Level
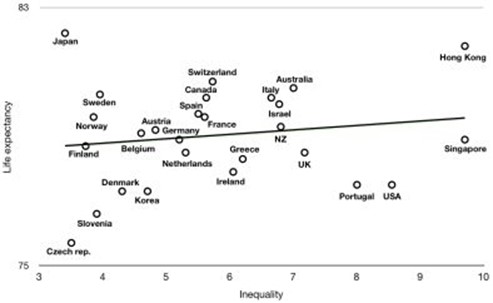
Below are the inequality and life expectancy graphs with and without the strategic deletion of important countries:
Inequality and life expectancy graph, The Spirit Level
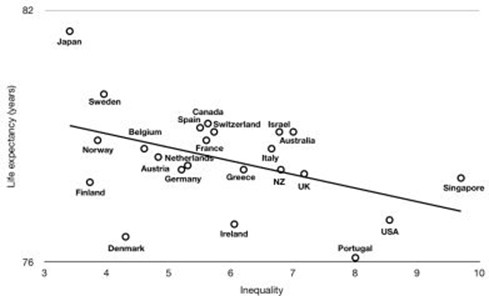
Inequality and life expectancy graph, UN (2006)
One of the interesting aspects of The Spirit Level is the claims that the authors make about their originality:
- In the first edition, their preface claimed that they had found something really new about the link between inequality and life expectancy and other quality-of-life variables.
- In the next edition of their book, their preface claimed that they were summarising the consensus of the scientific literature.
John Kay reviewed The Spirit Level in the Financial Times where he wrote:
The evidence presented in the book is mostly a series of scatter diagrams with a regression line drawn through them. No data is provided on the estimated equations, or on relevant statistical tests.
If you remove the bold lines from the diagram, the pattern of points mostly looks random, and the data dominated by a few outliers.


Recent Comments