There are large productivity differences between the global industrial leaders at the industry level. In a 1993 McKinsey’s study, large differences were uncovered in value added per worker between the USA, Japan, France, the UK and Germany across individual industries, by a factor of three in some cases (Prescott and Parente 2000, 2005).
- The USA competes with Japan for productivity leadership in many manufacturing industries.
- The Japanese services sector productivity can be as little as a one-third of that of the USA. Japanese labour productivity is almost twice Germany’s in producing automobiles and is better that Germany by a large margin for many other manufactured goods.
- The USA is uniformly more productive in services sector labour productivity. For example, British, French and German telecom workers were 38 to 56 per cent as productive as their American counter-parts.
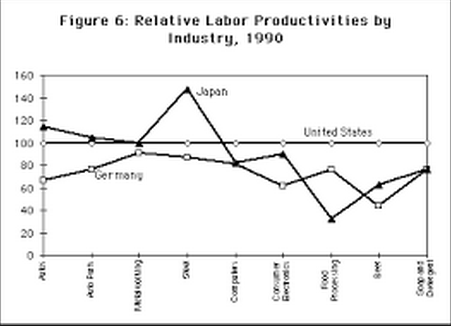
Figure 1: Relative Value Added Per Worker: Germany, Japan, and the United States Manufacturer’s Industries
| Industry | Japan | Germany |
| Automobiles | 116 | 66 |
| Automobile Parts | 124 | 76 |
| Metal Working | 119 | 100 |
| Steel | 145 | 100 |
| Computer | 95 | 89 |
| Consumer Electronics | 115 | 62 |
| Food | 33 | 76 |
| Beer | 69 | 44 |
| Soap and Detergent | 94 | 76 |
Differences in the access to the global pool of useful knowledge cannot explain such large productivity differences at the sector and the individual industry levels between the USA, Japan, France, the UK and Germany and between these three European neighbours. The stock of useful technological knowledge does not vary that much across these countries (Prescott and Parente 2000, 2005). These countries produce and are the markets for the majority of that knowledge.
Figure 2: Relative Value Added Per Worker – service industries
| Industry | Japan | Germany | U.K. | France |
| Retailing | 44 | 96 | 82 | 69 |
| Telecommunications | 66 | 50 | 38 | 56 |
| Banking | – | 68 | 64 | – |
Lags in technology diffusion cannot be important. The USA, Japan, France, the UK, and Germany define the global technological frontier.
Differences in the skills of the individual worker or in the total stock of human capital of all workers in a country cannot explain these differences in value added per worker. The USA, Japan, France, the UK and Germany all have relatively well-educated, experienced and tested labour forces. For example, the 1993 McKinsey’s study inquired into the education and skills levels of Japanese and German steel workers. Comparably skilled German steel workers were half as productive as their Japanese counterparts (Prescott and Parente 2000, 2005).
What differ between these countries at the glob technological frontier is the amount of the global pool of useful productive of knowledge that is used and as work practices. Ford Europe failed to adopt Japanese just-in-time production, but Ford U.S.A. has adopted it. In the beer industry, much of the high technology machinery in Japan and U.S. is manufactured in Germany but German breweries fail to use these more productive technologies. The less productive airline sector in Europe vis-à-vis the United States is the result of over-staffing.

Recent Comments