The political ideology of libertarians
19 Apr 2015 Leave a comment
in liberalism, libertarianism, politics - USA Tags: voter demographics
Support over time from marijuana decriminalisation was twin peaked in the USA
17 Apr 2015 Leave a comment
in economics of crime, law and economics, politics - USA Tags: marijuana decriminalisation, medical marijuana decriminalisation, voter demographics

The reasons of supporters & opponents of marijuana legalisation
15 Apr 2015 1 Comment
in economics of crime, health economics, law and economics, liberalism Tags: expressive voting, marijuana decriminalisation, meddlesome preferences, medical marijuana decriminalisation, rational ignorance, rational irrationality, voter demographics
Here are top reasons supporters & opponents of marijuana legalization give for their views pewrsr.ch/1PIaYUC http://t.co/hoPaMMQBXr—
Pew Research Center (@pewresearch) April 15, 2015
These rationales of thoroughly utilitarian and can actually be resolved by appeals to evidence. But the real reasons are the meddlesome preferences of the opponents of legalisation and the desire of the supporters of legalisation to smoke dope.
#Anti-Prohibition #demonstration in #Newark, #NewJersey, #1932 buff.ly/1GAEIOX #wewantbeer #beer #prohibition http://t.co/7Yr2ZjzHeN—
(@Pixxcell) April 06, 2015
What are the Democrat – Republican part as in spreads on the major issues
12 Apr 2015 Leave a comment

Who trusts which news source?
03 Apr 2015 Leave a comment
in economics of media and culture, industrial organisation, survivor principle Tags: media bias, voter demographics
@47Patriots @GaltsGirl @corrcomm @lyndseyfifield @CathyYoung63
whoever u r, u r more trustworthy than @BuzzFeed http://t.co/sv4snHyMF2—
SonOfPatriarchy (@sports2inflatio) April 02, 2015
The relative political importance of climate change
01 Apr 2015 Leave a comment
in environmental economics, global warming, politics - Australia, politics - New Zealand, politics - USA Tags: 2014 congressional elections, climate alarmism, global warming, opinion polls, voter demographics
Up until 2001, UK women were more likely to vote Tory than UK men
31 Mar 2015 Leave a comment
Interesting, because women’s demand for social insurance was a major driver of the growth of government in the 20th century.
The lesbian, gay, bisexual and transgender population vote for parties that welcome them
18 Mar 2015 Leave a comment
in liberalism, politics - Australia, politics - New Zealand, politics - USA, Public Choice Tags: expressive voting, voter demographics
The lesbian, gay, bisexual and transgender population is one of the most Democratic demographic groups in the country. According to the 2012 national exit polls conducted by the National Election Pool, gay, lesbian, and bisexual adults voted for Barack Obama over Mitt Romney by more than three-to-one (76% vs. 22%).
This Democratic advantage can be seen in the partisan identification of LGBT adults, a majority of whom are Democrats. It also expresses itself in policy preferences across a range of issues, including size of government, attitudes about gun policy and immigration…
Half of LGBT adults (50%) self-identify as liberal, 37% are moderate, and just 12% say they are conservative.

That’s hardly surprising that people vote for the parties that welcome them given the deep hostility of the Republican Party on lesbian, gay, bisexual and transgender issues. Until the middle of the 20th century, few black Americans voted for the Democratic party because it was the party of racism. People rarely vote for parties that really dislike them.

The transferability of these American results on partisanship to New Zealand is rather limited because there is no cultural war as there is in the USA currently over same-sex marriages. A same-sex marriage bill passed the New Zealand Parliament in 2013 fairly easily. The Christian based socially conservative parties in New Zealand are pretty tame in their rhetoric and still struggling to get into Parliament.

As such, the centre right parties in New Zealand aren’t seen as particularly hostile to the lesbian, gay, bisexual and transgender population. On the same-sex marriage bill, for example, the National Party split evenly on voting for and against, reflecting its moderation in just about every issue.

People of all sexualities can vote for New Zealand parties on grounds other than the fact of how welcoming they are to who they are. That makes the American results on partisanship and sexuality less relevant to New Zealand

Few UK green party voters are green: Green Party voters look like Lib Dems, think like Labour voters
19 Feb 2015 Leave a comment
in politics - Australia, politics - New Zealand, Public Choice Tags: expressive voting, protest voters, Uk Greens, UK politics, voter demographics

Fewer the mushrooming green party vote in the UK too much at all about the environment. It certainly not the major reason for going green.
Green voters are not radically left-wing on economic issues nor are they primarily driven by environmental concerns. How, therefore, can we explain their decision to vote for a party with a far-left, environmentalist agenda?
One way is to look at who prospective Green voters turned to in previous elections…. Around half voted for the Liberal Democrats in 2010 and around a third voted for the junior coalition partner in both 2005 and 2010. There are a number of ways of interpreting this.
First, Liberal Democrats and Green voters traditionally hold similar socio-demographic profiles. Both are likely to be university educated and to work in professional or managerial jobs.
Second, the Lib Dems were, until the 2010 election, the protest vote of many on the left. Since entering government, they have lost this niche and, subsequently, have seen their poll ratings plummet.
Third, the Greens now have a monopoly on certain policies that they once shared with Nick Clegg’s party – for example, ending university tuition fees.
.
Voter demographics alert: the politics of road rage
19 Feb 2015 Leave a comment
in economics of crime, Public Choice, transport economics Tags: road rage, voter demographics

.
Green and UKIP voters have common key concerns
19 Feb 2015 Leave a comment
Both seriously dislike politicians.
The working class is missing from US political discourse
14 Feb 2015 Leave a comment
in income redistribution, politics - USA, Public Choice Tags: 2008 presidential election, Director's Law, expressive voting, median voter theorem, voter demographics, Withering away of the proletariat
One of the things I noticed in the 2008 US presidential campaign was everyone was appealing for the middle class vote. Presidential primary and general election debates were about how things were getting harder for the middle-class and the Republican or Democratic candidate who happen to be pitching for votes would stand up for the middle-class better than their competition in the presidential primary or general election at hand.
Another big feature in the 2008 presidential campaign was Joe the plumber. This was the small businessman who asked then candidate Obama at a rope line three days before the final presidential debate about his plans to put up taxes. Obama replied he wanted to spread the wealth around. Obama’s response was
It’s not that I want to punish your success. I just want to make sure that everybody who is behind you, that they’ve got a chance at success, too… My attitude is that if the economy’s good for folks from the bottom up, it’s gonna be good for everybody.
If you’ve got a plumbing business, you’re gonna be better off… if you’ve got a whole bunch of customers who can afford to hire you, and right now everybody’s so pinched that business is bad for everybody and I think when you spread the wealth around, it’s good for everybody
Andrew Cherlin did the service counting up references to the working class in State of the Union addresses since President Obama was elected.
In his State of the Union addresses, Obama has used the term middle class 28 times. But he has never said “working class” except in 2011, when he described Vice President Biden, who was seated behind him, as “a working-class kid from Scranton.”
This dearth of references to the working class is no surprise in light of Director’s Law and the median voter theorem. Politicians who do not pitch to the American middle class will not win elections unless there is a lot of expressive voting by the educated middle class. In general social surveys of Americans, 44% identify as working class and 44% identify as middle class.

Republicans consistently win voters making $50,000 or more – the U.S. median income. The margin doesn’t vary much: In 2012, Mitt Romney got 53% of this group’s vote; in 2010, Republican House candidates got 55%.
The margin by which the Republicans win income brackets above 50,000 doesn’t vary much if you just look at those earning above $100,000 or those earning between $50,000 and $75,000. These margins only matter in a close election, a very close election.
Democrats consistently win voters making less than the median but the margin varies. Whether the Democrats win these voters earning less than $50,000 by a 10-point or a 20-point margin tells you who won every national election for the past decade.

The Democrats would also do well among the college educated vote. Obama won this over Romney and 2012 by 10 percentage points. This may explain why the Democrats are slightly conflicting: they must win the working class vote as well as the college educated vote to win.
Andrew Cherlin didn’t give many reasons for the disappearance of working class from modern American political discourse, but he showed some insight into expressive politics when he observed that:
Politicians may prefer to call working-class families by the class position they aspire to rather than the one they hold.

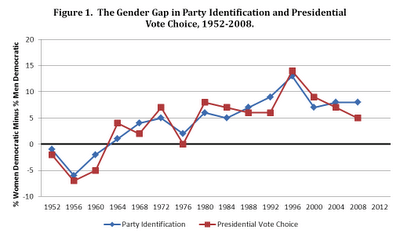
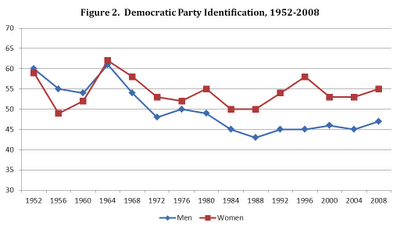
Parties and the Gender Gap | The Mischiefs of Faction
07 Feb 2015 Leave a comment
in politics - New Zealand, politics - USA, Public Choice Tags: voter demographics
In search of libertarians | Pew Research Center
07 Feb 2015 Leave a comment
in liberalism, libertarianism Tags: voter demographics


Recent Comments