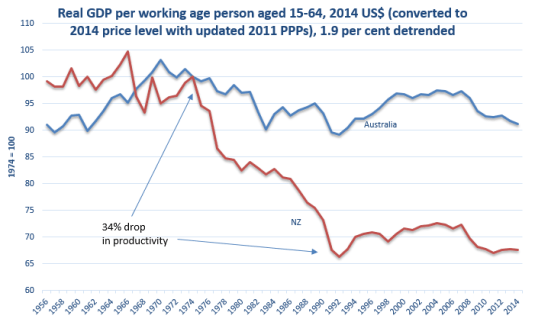
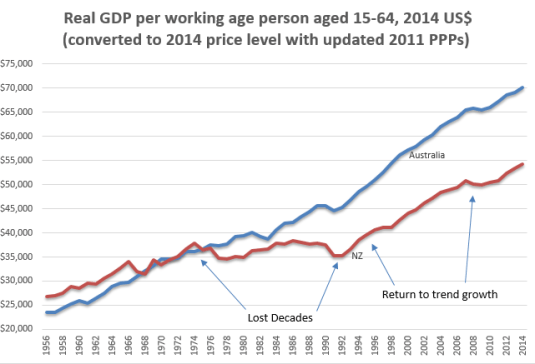
I have updated my estimates of Australian and New Zealand detrended real GDP growth for the 2014 working age population statistics from the OECD. The charts show:
- the lost decades of New Zealand growth between 1974 and 1992;
- the return of trend growth between 1992 and 2007 but no rebounding to recover lost ground;
- the effects of the global financial crisis in Australia and New Zealand; and
- a return to trend growth in New Zealand since about 2010 but not in Australia.
Source: Computed from OECD Stat Extract and The Conference Board. 2015. The Conference Board Total Economy Database™, May 2015, http://www.conference-board.org/data/economydatabase/
The real GDP data in the above chart is detrended by 1.9% per annum. 1.9% growth per year is the trend real GDP growth rate of the USA in the 20th century. The growth rate of the USA is taken as the growth rate of the global technological frontier. A flat line in the above chart is real GDP growth at 1.9% per year. A falling line is real GDP growth in that year of less than 1.9%; a rising line is growth that is greater than 1.9% in that year.
Source: Computed from OECD Stat Extract and The Conference Board. 2015. The Conference Board Total Economy Database™, May 2015, http://www.conference-board.org/data/economydatabase/

Recent Comments