The U.S. “stock market” is represented by various collections of stocks, such as the Dow Jones Industrial Average (30 stocks), the NASDAQ Composite (securities listed on the NASDAQ; weighted towards information technology), and the Standard and Poor’s 500 Index. The S&P 500 is an index of the largest 500 companies listed on the New York Stock Exchange and the NASDAQ, weighted by capitalization. The version of the S&P usually cited just takes into account stock prices. History shows that, over a reasonably long-time frame, the U.S. stock market rises. Here is a chart, using a logarithmic axis, of the S&P from January, 1950 to February, 2016. It shows a rise in value by a factor of about 65 between 1950 and 2016.
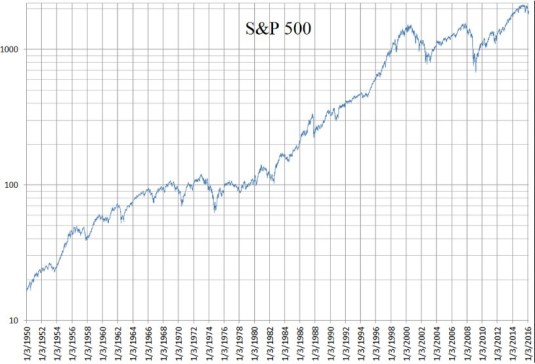
S&P 500 daily closing values from January 3, 1950 to February 19, 2016
Source: https://en.wikipedia.org/wiki/S%26P_500_Index
Below is a chart of S&P values from 1980 to 2021 on a…
View original post 689 more words

Recent Comments