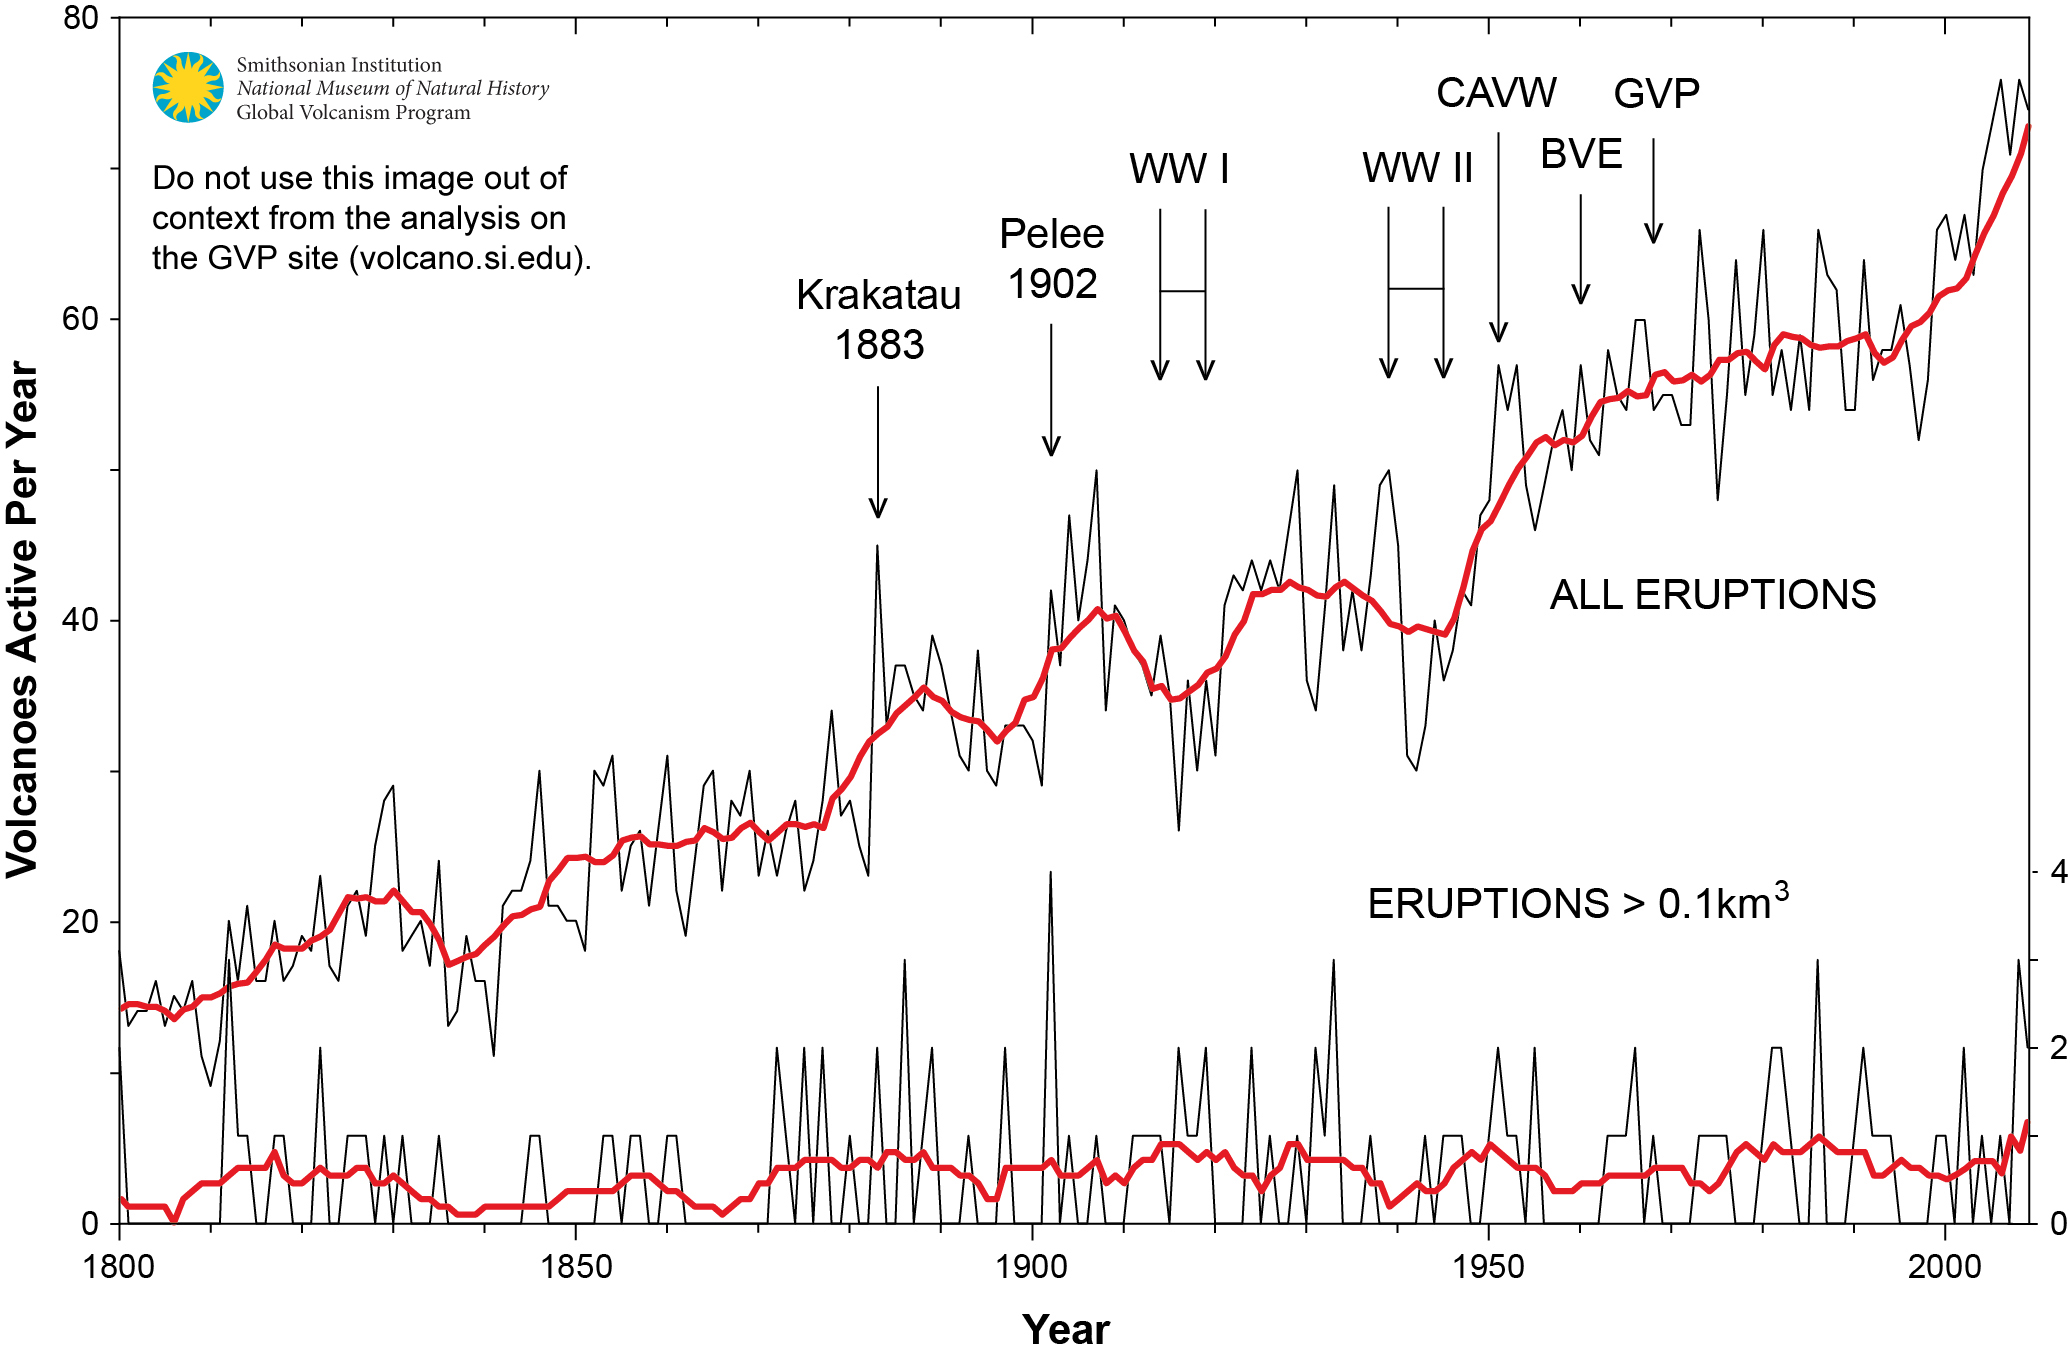
 Figure 1. Graph showing the number of volcanoes reported to have been active each year since 1800 CE. Total number of volcanoes with reported eruptions per year (thin upper black line) and 10-year running mean of same data (thick upper red line). Lower lines show only the annual number of volcanoes producing large eruptions (>= 0.1 km3 of tephra or magma) and scale is enlarged on the right axis; thick red lower line again shows 10-year running mean. Global Volcanism Project Discussion
Update April 28, 2023
I am prompted by a discussion at WUWT regarding the role of SO2 in causing climate variabiity. There are some voices claiming that reduced SO2 from smaller vocanic activity in the Middle Ages caused warming, leading to droughts, crop failures, etc. And that we could be causing global warming by removing SO2 from the air in modern times. As the research cited below explains…
View original post 3,002 more words

Recent Comments