A time traveller’s perspective on the anti-vaccination movement
19 Dec 2014 Leave a comment
in economic history, health economics
The magic and miracle of the marketplace: Christmas 1964 vs. 2014 – there’s no comparison » AEI
19 Dec 2014 Leave a comment
in economic history, Rawls and Nozick Tags: The Great Enrichment


via The magic and miracle of the marketplace: Christmas 1964 vs. 2014 – there’s no comparison » AEI.
The rise of the working rich among the top 0.1% in the USA
19 Dec 2014 Leave a comment
in applied welfare economics, economic history, entrepreneurship, politics - USA, poverty and inequality

Source: “Income Inequality in the United States, 1913-1998” with Thomas Piketty, Quarterly Journal of Economics, 118(1), 2003, 1-39
(Tables and Figures Updated to 2012 in Excel format, September 2013) via Chad Jones
Before 1940, most of the income of the top 0.1% of income earners in the USA was income from investments.
By the end of the 20th century, the top 0.1% were earning their incomes as wages and salaries, business incomes and capital gains. Very little of that income of the top 0.1% was in the form of passive income from capital. The top 0.1% of the USA are now working rich – entrepreneurs.
Where the Great Wall of China ends
19 Dec 2014 Leave a comment
in economic history Tags: Great Wall of China

1925 Rolls Royce Phantom
17 Dec 2014 Leave a comment
How much do the top income earners actually earn in NZ?
16 Dec 2014 Leave a comment
in economic history, income redistribution, labour economics, politics - New Zealand, Rawls and Nozick Tags: top 1%

Source: topincomes-parisschoolofeconomics
Note: top income share data for adults for New Zealand adults go back only as far as 1953.
To begin with, a large number of people who see themselves as middle class will have to reclassify themselves in terms of class membership.
More importantly, they will have to pick up on their class consciousness because they are either in the top 10% as any successful professional is because the average income of the top 10% in New Zealand is $128,000. With a bit of luck, these members of the ruling class will be able to afford a house in Auckland without having to borrow from mum and dad.
Pretty much every successful professional is in the top 5% in New Zealand, with an average income of $170,000.
These rich have a lot of people look down upon and order about as junior or senior members of the ruling class, even if they did know they were a member of the ruling class until they looked at the diagram above. Welcome to the ruling class. Goodbye to the middle-class. Get over it.
As for the top 1% in New Zealand, they have an average income in 2011 of $336,000. Once again, successful professionals, successful entrepreneurs and what’s left of the rentier class will have to accept that supreme power as the ruling class of the capitalist system is open to just about anybody who does well at university and enters the professions. Are there no standards?
As for the top 0.5%, data on the top 0.1% stopped in 1989, they earned an average of $457,000 a year in 2011. That is starting to look like good money, though you do have to brush shoulders with celebrities, athletes and more than a few successful small entrepreneurs, but at least you are starting to earn a lot more than your average suburban doctor who is a member of the top 10%.
The ruling class is not what it used to be – the rentier class, old money. That the rich of today – the ruling class of the capitalist system – is open to many ordinary people who are new rich or just plain urban professionals, athletes, musicians and celebrities is a common finding all round the world. As Piketty and Saez explained for the USA:
This rise in top income shares is not due to the revival of top capital incomes, but rather to the very large increases in top wages (especially top executive compensation).
As a consequence, top executives (the “working rich”) have replaced top capital owners at the top of the income hierarchy over the course of the twentieth century.
Many of the rich both in New Zealand and overseas are working rich who made their money themselves and came from middle class or upper middle-class backgrounds.
Many of these rich are well educated smart people rather than the inheritors of wealth. The working rich and most of the rich of the 21st century must be well educated because so many of them are professionals in occupations where you must succeed at university to get in the ground floor, or they are athletes, musicians and other celebrities who must work their way up from the bottom.
A large number of New Zealanders who regarded themselves as middle class action are part of the rich – the top 10%, top 5% and banging on the doors of the top 1% or better – so they better start carrying themselves about with the airs and graces of the ruling class. Better practice by putting a plum in your mouth.
p.s. There was a big spike in top incomes in 1999. It seems like a lot of people in New Zealand brought forward income in 1998 and 1999 in anticipation of the election of a Labour Party government in the 1999 New Zealand general election, and an immediate increase in the top tax rate from 33% to 39% for incomes over $60,000.
Women and Minorities in Human History
16 Dec 2014 Leave a comment
in discrimination, economic history, gender, labour economics, liberalism Tags: engines of liberation, gender, sex discrimination, The Great Fact
Deirdre McCloskey compares John Kenneth Galbraith with Joseph Schumpeter
16 Dec 2014 Leave a comment

Scott’s Antarctic expedition
16 Dec 2014 Leave a comment
Scott's Antarctic expedition from the 1910s http://t.co/xmBIHubCPV—
History In Pictures (@HistoryInPics) December 15, 2014
@bryce_edwards New Zealand’s war on the poor – a fact check
15 Dec 2014 Leave a comment
in economic history, income redistribution, labour economics, Marxist economics, politics - USA, technological progress Tags: Bryce Edwards, Leftover Left, poverty and inequality
Bryce Edwards has shown in today’s column that he knows nothing about inequality in New Zealand, despite the statistics being at his fingertips:
Under capitalism there’s always going to be a war against the poor.
The process by which we divide up the resources of any society normally involves exploiting the majority for the benefit of the minority.
It’s called inequality. And this is how it is in New Zealand: those who have the most power look for ways to extract that money for themselves, or at least retain the status quo.
Against this are those who want to have a more equal society. It’s an age-old political issue, and one that has traditionally been at the heart of the left-right political divide.
In 2014 this concern about inequality has been a key feature of politics, underpinning much of what has occur…
Although the rich appear to have been winning for three decades in their ‘war against the poor’, perhaps the tide is turning?
There’s still every indication of severe poverty and inequality in this country.
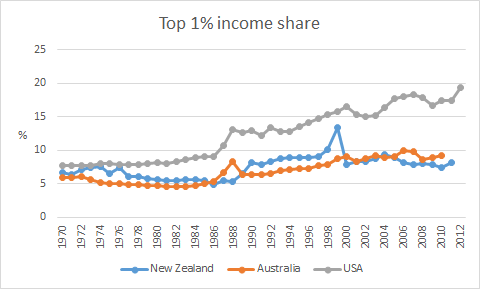
Firstly, inequality has not increased in New Zealand for at least 20 years when either measured in figure 1 by the Gini coefficient or in figure 2, the top 1% income shares. Both the Gini coefficient and the top 1% income shares have not risen for 20 years.
Figure 1: Gini coefficient New Zealand 1980-2015

Source: Bryan Perry, Household incomes in New Zealand: Trends in indicators of inequality and hardship 1982 to 2013. Ministry of Social Development (July 2014).
Figure 2: Top 1% income shares, USA, New Zealand and Australia, 1970-2012
Source: top incomes database
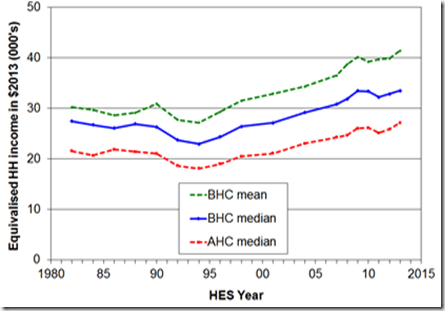
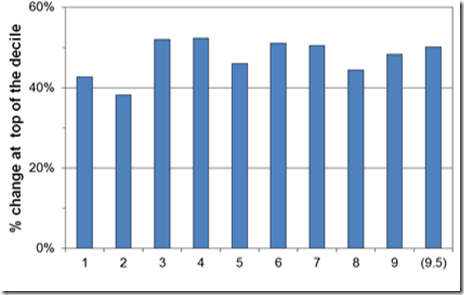
Secondly, the benefits of the economic boom that lasted 15 years from the early 1990s until the onset of the global financial crisis would spread broadly across all sections of the New Zealand community. As shown in figure 3, both before and after housing costs increased. As shown in figure 4, real household incomes increased pretty much evenly across all of the 10 income deciles between 1994 and 2013.
Figure 3: Real household income trends before housing costs (BHC) and after housing costs (AHC), 1982 to 2013 ($2013)
Source: Bryan Perry, Household incomes in New Zealand: Trends in indicators of inequality and hardship 1982 to 2013. Ministry of Social Development (July 2014).
Figure 4: Real household incomes (BHC), changes for top of income deciles, 1994 to 2013
Source: Bryan Perry, Household incomes in New Zealand: Trends in indicators of inequality and hardship 1982 to 2013. Ministry of Social Development (July 2014).
Thirdly, as shown in figure 5, between 1994 and 2010, real equivalised median household income rose 47% from 1994 to 2010; for Māori, this rise was 68%; for Pasifika, the rise was 77%. Median household income increases of nearly 50% in 16 years should be celebrated.
Figure 5: Real equivalised median household income (before housing costs) by ethnicity, 1988 to 2013 ($2013).

Source: Bryan Perry, Household incomes in New Zealand: Trends in indicators of inequality and hardship 1982 to 2013. Ministry of Social Development (July 2014).
The massive improvements in Māori incomes since 1992 were based on rising Māori employment rates, fewer Māori on benefits, more Māori moving into higher paying jobs, and greater Māori educational attainment. Māori unemployment reached a 20-year low of 8 per cent from 2005 to 2008.
Over the last more than two decades in New Zealand, there has been sustained income growth spread across all of New Zealand society contrary to the warmed over Marxism of Bryce Edwards. Perry (2014) reviews the data every year for the Ministry of Social Development. He concluded that:
Overall, there is no evidence of any sustained rise or fall in inequality in the last two decades.
The level of household disposable income inequality in New Zealand is a little above the OECD median.
The share of total income received by the top 1% of individuals is at the low end of the OECD rankings.
Bryce Edwards’ analysis was in the typical Marxist tradition – it had no gender analysis. He failed to mention that New Zealand has the smallest gender wage gap of all the industrialised countries.

As he did not notice these great successes in household incomes, incomes of every decile, Māori economic development and the empowerment of women, Bryce Edwards had nothing to add in terms of either consolidating or improving on them.

U2 – I think we’ll pass
13 Dec 2014 Leave a comment
Comparing sea ice today to Shackleton’s Ill Fated Voyage – 100 years ago this month
12 Dec 2014 Leave a comment
in economic history, organisational economics, personnel economics Tags: Ernest Shackleton
I am a great admirer of Ernest Shackleton – his unlimited determination and boundless courage
Early Adoption of Technologies since 1750 till 2012
08 Dec 2014 Leave a comment
in applied welfare economics, economic growth, economic history, entrepreneurship Tags: 10-90 lag, international technology diffusion, technology diffusion, technology usage lags
Deigo Comin has been doing excellent work documenting both the length of 10-90 technology lags even for major technologies we now take for granted, and the contribution of these technology usage lags to international differences in living standards and post-war growth rates.
The East Asian Tigers all coincided with a catch-up in the range of technologies used with respect to industrialized countries. These development miracles all involved a substantial reduction of their technology adoption lags relative to (other) OECD countries
15 to 30 years is a common technology usage lag even within the United States for the 10-90 technology lag. The 10-90 lag is how long it takes between when 10% of industry is using a technology, and 90% of an industry is using that technology.


There is a plenty of research carried out about how important early adoption of technology is. I’ve recently skimmed a couple of researches on this topic. In my opinion there are two authors that made a better job than others. Their names are Diego Comin and Bart Hobijn.
They performed a cross-country analysis called Cross-country Historical Adoption of Technology (CHAT). This research dataset covers the diffusion of 104 technologies in 161 countries during the last 200 years. The data is available for download.
I just want to share with you the results of their report which could help better understand what’s happening in today’s world of innovations and entrepreneurship and what expect from future.
Finding # 1. “On average, countries adopted a new technology 45 years after its invention.”
Finding # 2. “Variation in adoption rates is larger than you might expect and accounts for 25% of differences…
View original post 95 more words


Recent Comments