Some economics of the marriage bars (and mandatory retirement ages)

Up until 1966, women had to quit from the Australian Public Service when they married! The bar was repealed in 1966 with a private members bill by Bill Hayden.

Some hid their marriages for years, hiding their rings before they got to work.

One woman remained unmarried and bore four children. She managed this by timing her annual leave to cover the births.

While her personnel area was co-operative, they forced her to resign her middle management position when she decided to make an honest man of her de facto husband by marrying the father of their children.

Claudia Goldin found that marriage bars were policies adopted by firms and local school boards, from about the early 1900’s to 1950. They fired single women when they married and would not not to hire married women.

The marriage bar, which had at its height affected 751 of all local school boards in the USA and more than 50% of all office workers, was virtually abandoned in the 1950’s when the cost of limiting labour supply greatly increased.

When marriage bars disappeared, Goldin found that older female workers in the mid-1950’s were suddenly praised for their “maturity, reliability, neat appearance, and less chatty nature”.

In retail trades, and especially in suburban retail shops, Goldin found that older married women with absolutely no previous training were now the “ideal employee”; the middle-class woman were “naturally courteous” and “well-bred,” and who did not have to work became the preferred recruits of the major department stores. the best female employee was, in the words of a Sears, Roebuck, and Co. officer

a married woman with a mortgage on her house and her children partially raised

These sudden changes in the attitude of employers towards the recruitment of women of different ages and marital status suggests that the previous personnel policies were disciplined by competition.

Marriage bars, in the private sector, were instituted by large firms with centralised hiring promotion and salary schedules that were often fixed and based on tenure with the firm, and other modern employment practices.

This evidence suggested to Claudia Goldin that firms may have wanted to encourage turnover when earnings rose more rapidly with tenure than productivity. These  employers in firms with rigid wage systems, tied to their workers’ seniority, desired a young, inexperienced work force. Goldin hypothesise that the marriage bar was a socially acceptable way of terminating the employment of young women whose wages would eventually rise to exceed their addition revenue to the firm.

Goldin suggested that the marriage bar had some relationship to seniority pay, as discussed by Edward Lazear.

Under seniority pay, and employees paid less than their productivity in their early years of employment but more in their later years of employment up to say a retirement date.

By back loading salary, the employer could economise on the cost of monitoring the employee’s performance and especially so in jobs where it was hard to evaluate performance. Because of the prize at the end of the road: a large salary paid towards the end of a career, an employee had more reasons to be honest and not to underperform and risk dismissal.

Not all workers may be compensated under long-term seniority pay contracts. Routine office workers, support staff, sales agents, and so on appear to be compensated on a spot basis rather than under long-term incentive contracts.

Workers in these more routine occupations have lower monitoring costs. Their productivity can be more easily and cheaply  measure directly.

There is no need for sophisticated incentive contracts as is the case more often with managerial Employees and workers who hold positions of trust. In both cases , the back loading a salary operates as a bond against poor performance and dishonesty.

Most women entered the workforce by the age of 18 in the mid to early 20th century. They married in their early to mid-20s. This meant that the maximum length of their career with the firm would be 5 to 7, maybe 10 years.

Because these women are often assigned to low skilled clerical duties where there are a few promotion prospects, the productivity of these women did not increase much with time in the job.

To make sure that some women didn’t stay on to receive the seniority based salary increases by not marrying, Goldin found that some firms offered a substantial dowry is to women when they married if that already been with the firm for six years.

These dowries were buying women out of jobs where their wages were rising, but their productivity was stable.

Another advantage of buying women out of their jobs when they married was that the male co-workers didn’t have to be paid a wage premium for less job security can as they themselves could be dismissed on similar grounds.

Marriage bars were found by Goldin to be associated with fixed salary scales, internal promotion, and other personnel practices and they are not associated with piece-rate work.

Subsequent work on mandatory retirement ages in the public private sector found a similar link to both seniority pay and organisational architecture and the the limits of individual managerial discretion over firing.

The organisational architecture of a firm encompasses the assignment of decision rights within the firm, the methods of rewarding individual employees, and the structure of the systems that evaluate the performance of individual employees and business units.

Some larger firms may struggle to administer internal corporate governance structures which permit more local managerial discretion over employment relationship matters and still properly control the costs of a more diverse workforce.

A price of growth in the size of a firm is often the standardisation of products, workforce compositions and terms of employment.

When mandatory retirement was lawful, large firms with centralised personnel structures are more often to be found to have mandatory retirement ages.

The nub of the problem is large firms have several layers of management with fairly strict limits on what each individual line manager can do (Williamson 1975, 1985; Fama and Jensen 1983b).

There must be limits on local managerial discretion because the owners and senior managers set the strategic direction of the firm, the products it sells, and how many workers are employed and on what wages.

Larger firms may struggle with striking the most profitable balance between greater local managerial discretion and effective corporate governance of a large diverse organisation with professional managers and diffuse ownership structures. It will be shown that very large firms promulgate rigid personnel policies while smaller firms are much more flexible in their deals with individual employees.

This balance between local managerial discretion and central control must extend to wages and hours because labour costs make up much of the costs of many firms. Changes in policies on wages and conditions are subject to ratification and monitoring by head office and the corporate board in managerial firms.

This increasing rigid separation of decision management rights from decision control rights as a managerial firm grows will restrict flexibility in terms of employment, including phased retirements. Top level managers and board members both have limited amount of time to allocate, limited spans of control, and will have less and less detailed knowledge of their firm as it grows.

Limits on the degree of local managerial discretion over employment relations in large managerial firms can arise from restrictions on managerial delegations, divided decision making rights, hierarchical approval procedures, and the breath and content of wage and personnel policies. This can include not having a personnel policy on the availability of phased retirements. This gap can be through choice, inertia or attention to other concerns currently of a higher priority.

The discretion of supervisors in large firms over the terms and conditions of employment of individual members of their team may be limited to individual performance ratings (Gibbs and Hendricks 2004).

Smaller firms have more more discretion over retirement ages was is less of a separation of ownership and control, and owners are much more able to be on-site and of balance risks and rewards from innovations.

Good evidence to illustrate the proposition that larger firms prefer rigid rules over discretion in personnel policies comes from the days of mandatory retirement. Mandatory retirements can be viewed as the wholesale substitution of local managerial discretion with a single company-wide rule because larger firms find idiosyncratic decisions to be more costly (Parsons 1997).

Back when they were legal, mandatory retirements are near universal in very large workplaces, but in small to medium size firms, there were flexible retirement polices. Few very large firms reported flexible retirement polices. The smaller firms provided for policies that allowed for exceptions to mandatory retirement rules while most of largest firm reported a policy of zero exceptions to mandatory retirement rules (Parsons 1997).

The line managers in small firms were more willing to allow an older worker to work passed the usual retirement age because they had more delegations with regard to terms and conditions of employment. In addition, in smaller firms, the owners are more likely to be among the management team for the CEO and able to closely supervise the success of the discretionary decisions of junior management over conditions of employment and hiring and firing.

Richard Posner described the engines of women’s liberation

Image

Involuntary unemployment and the great vacation theories of the great depression and Eurosclerosis – updated again

Most Keynesian economists are convinced that something exists called involuntary unemployment and people can be unemployed through no fault of their own. They will accept the going wage but no employer is willing to offer it to them.

Lucas and Rapping’s (1969) paper, “Real Wages, Employment, and Inflation” provides the micro-foundations for an analysis of the labour suppl. They felt the need to reconcile the existence of unemployment with market clearing and referred to recent work of Armen Alchian (1969) on search explanations of unemployment.

Lucas and Rapping viewed unemployment as voluntary, including the mass unemployment during the great depression (Lucas and Rapping 1969: 748).

Lucas and-Rapping viewed current labour demand as a negative function of the current real wage. Current labour supply was a positive function of the real wage and the expected real interest rate, but a negative function of the expected future wage.

Under their framework, if workers expect higher real wages in the future or a lower real interest rate, current labour supply would be depressed, employment would fall, unemployment rise, and real wages increase.

Lucas and Rapping depicted labour suppliers as rational optimisers who engaged in inter-temporal substitution: working more when current wages were high relative to expected wages. The prevailing Keynesian approach assumed labour supply was passive, and movements in the demand for labour determined changes in employment.

Lucas and Rapping offered an unemployment equation relating the unemployment rate to actual versus anticipated nominal wages, and actual versus anticipated price levels. Unemployment could be the product of expectational errors about wages.

Lucas and Rapping’s model was poor at explaining unemployment after 1933 in terms of job search and expectational errors.

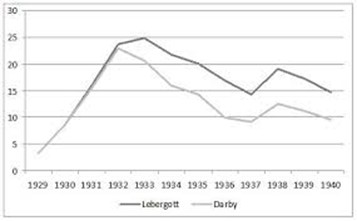
The graph below shows two different series for unemployment in the 1930s in the USA: the official BLS level by Lebergott; and a data series constructed famously by Darby. Darby includes workers in the emergency government labour force as employed – the most important being the Civil Works Administration (CWA) and the Works Progress Administration (WPA).

Once these workfare programs are accounted for, the level of U.S. unemployment fell from 22.9% in 1932 to 9.1% in 1937, a reduction of 13.8%. For 1934-1941, the corrected unemployment levels are reduced by two to three-and-a half million people and the unemployment rates by 4 to 7 percentage points after 1933.

Not surprisingly, Darby titled his 1976 Journal of Political Economy article Three-and-a-Half Million U.S. Employees Have Been Mislaid: Or, an Explanation of Unemployment, 1934-1941.

The corrected data by Darby shows stronger movement toward the natural unemployment rate after 1933. Darby concluded that his corrected date are suggests that the unemployment rate was well explained by a job search model such as that by Lucas and Rapping together with the wage fixing under the New Deal that kept real wages up and unemployment high.

Both the Keynesian approach to unemployment and the job search approach to unemployment view workers in emergency government work programs as employed and not as unemployed.

In the late 1970s, Modigliani dismissed the new classical explanation of the U.S. great depression in which the 1930s unemployment was mass voluntary unemployment as follows:

Sargent (1976) has attempted to remedy this fatal flaw by hypothesizing that the persistent and large fluctuations in unemployment reflect merely corresponding swings in the natural rate itself.

In other words, what happened to the U.S. in the 1930’s was a severe attack of contagious laziness!

I can only say that, despite Sargent’s ingenuity, neither I nor, I expect most others at least of the nonMonetarist persuasion,. are quite ready yet. to turn over the field of economic fluctuations to the social psychologist!

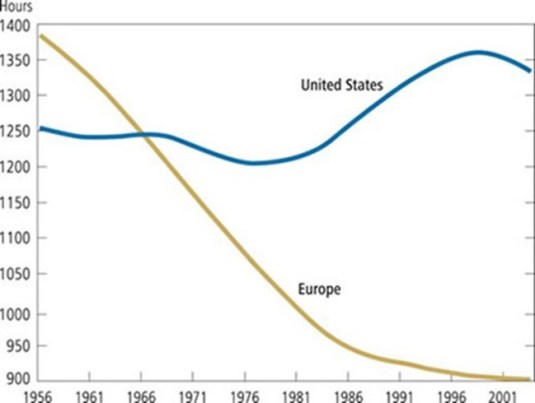
As Prescott has pointed out, the USA in the Great Depression and France since the 1970s both had 30% drops in hours worked per adult. That is why Prescott refers to France’s economy as depressed. The reason for the depressed state of the French (and German) economies is taxes, according to Prescott:

Virtually all of the large differences between U.S. labour supply and those of Germany and France are due to differences in tax systems.

Europeans face higher tax rates than Americans, and European tax rates have risen significantly over the past several decades.

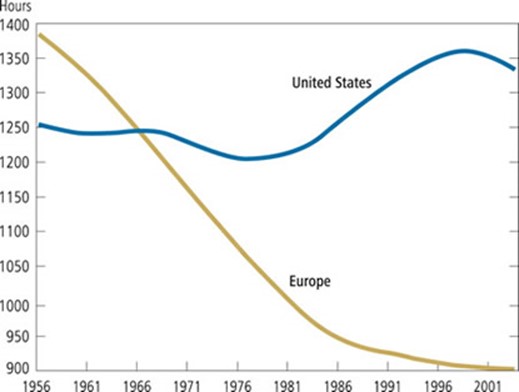
In the 1960s, the number of hours worked was about the same. Since then, the number of hours has stayed level in the United States, while it has declined substantially in Europe. Countries with high tax rates devote less time to market work, but more time to home activities, such as cooking and cleaning. The European services sector is much smaller than in the USA.

Time use studies find that lower hours of market work in Europe is entirely offset by higher hours of home production, implying that Europeans do not enjoy more leisure than Americans despite the widespread impression that they do.

Richard Rogerson, 2007 in “Taxation and market work: is Scandinavia an outlier?” found that how the government spends tax revenues when assessing the effects of tax rates on aggregate hours of market work:

  1. Different forms of government spending imply different elasticities of hours of work with regard to tax rates;
  2. While tax rates are highest in Scandinavia, hours worked in Scandinavia are significantly higher than they are in Continental Europe with differences in the form of government spending can potentially account for this pattern; and
  3. There is a much higher rate of government employment and greater expenditures on child and elderly care in Scandinavia.

Examining how tax revenue is spent is central to understanding labour supply effects:

  1. If higher taxes fund disability payments which may only be received when not in work, the effect on hours worked is greater relative to a lump-sum transfer; and
  2. If higher taxes subsidise day care for individuals who work, then the effect on hours of work will be less than under the lump-sum transfer case.

Others such as Blanchard attribute the much lower labour force participation in the EU since the 1970s to their greater preference for leisure in Europe. An increased preference for leisure is another name for voluntary unemployment.

The lower labour force participation in higher unemployment in Europe is voluntary because of the higher demand for leisure among Europeans.  According to Blanchard:

The main difference [between the continents] is that Europe has used some of the increase in productivity to increase leisure rather than income, while the U.S. has done the opposite.

An unusual left-right unity ticket emerged to explain the great depression in the 1930s and the depressed EU economies from the 1970s: the great vacation theory.

The economics of parenting | VOX, CEPR’s Policy Portal

across OECD economies parents in more unequal countries place more emphasis on hard work, and consider imagination and independence to be less important.


via The economics of parenting | VOX, CEPR’s Policy Portal.

Is welfare dependence optimal for whom – part 4: In-work tax credits and labour supply

In-work tax credits were introduced in many countries including New Zealand to encourage movement into employment by breadwinners. By linking a large payment with full-time and semi-full-time work, the rewards for working are increased for single parents and families. These in work tax credits combined child tax credit with an in work tax credit for the sole mother or couple.

These in-work benefits can phase-in when a minimum income level is reach such as with the Earned Income Tax Credit (EITC) in the USA, or a paid in full when a minimum number of hours are worked. The Working for Families in-work tax credit in New Zealand and the UK family tax credit are two examples where there is a large cash payment with no phasing-in:

  • Working for Families in New Zealand is paid if 30 hours are worked by New Zealand families or 20 hours are worked by sole parents; and
  • The British family tax credit was paid if 16 hours are worked, initially 24 hours per week.

Figure 1 shows the impact of the introduction of an in-work tax credit paid in full to families and sole parents if a minimum number of hours per week are worked by a family or sole parent. There is no phase-in region such as with the earned income tax credit (EITC) in the USA.

Figure 1: In work tax credits and labour supply

in-work tax credits and labour supply

The in-work tax credit phases-out after once the family’s income increases past an income threshold. This income threshold is usually linked to the number of children as well.

An in-work family tax credit linked to a high number of minimum number of hours worked provides an incentive for those not in work to increase their hours worked by a large amount and leave welfare, as is shown by arrow 1 in Figure 1.

For those already work, the income and substitution effect cut against each other and their net effect depend on the number of hours currently worked.

  • Those working a low number of hours, hours less per week than the minimum to qualify for the in-work tax-credit have an incentive to increase their hours to the minimum to qualify and leave welfare is shown by arrow 2 in Figure 1.
  • Arrows 3 and 4 in Figure 1 both represent reduction in hours worked.
  • Some workers can take-home more pay and work fewer hours per week or per year as shown by arrow 3.
  • Other high working hours worker can enjoy more leisure time at the expense of a slightly reduced take-home pay as shown by arrow 4.

The net labour supply effects of an in-work tax credit are therefore ambiguous because of these multiplicity of labour supply effects with some people working more another’s work in letters.

There will also be a bunching of hours worked at around the eligibility point for paying the in-work tax credit. The eligibility point is usually grouped around working a minimum of three or four days per week part or full-time that sum to 30 hours for families and 20 hours for sole parents.

Workers working less that the weekly working hour minimums will increase to the minimum to qualify for the family tax credit. Workers working more than the minimum required to qualify for the family tax credit might cut back to the working hours minimum because of the superior labour leisure trade-off. The number of people on welfare will fall because workers leave part and full benefit dependence to qualify for the in-work tax credit.

Whether labour supply on net actually increases or decreases depends on the relative numbers of individuals at different points on the budget constraint working full-time, not working and working part-time and on the magnitudes of their responses. Some will stay as they are working full-time, not working and working part-time.

To summarise, the static labour–leisure trade-off model of labour supply suggests that increases in either benefit abatement thresholds or a reduction in benefit abatement rates will increase the numbers entering the benefit and see none leave. No one will leave.

A hours worked per week based in-work tax credit will move people who are not working and working a low number of hours to work and into a higher number of work hours respectively, with bunching around the eligibility point. An in-work tax credit will also cause some to cut back their hours so the net labour supply effect is ambiguous.

The net fiscal cost of an in-work tax credit depends on the phase-in and phased out particulars of the tax credit programme and the increase in paid employment and the number of taxpaying workers as a result of the in-work tax credit. The Working for Families tax credits in New Zealand and the United Kingdom are famous for clustering of labour supply around the eligibility point for the in work tax credit.

single mum graphic

For example, in the UK, a lot of people used to work exactly 24 hours week. When the eligibility point was reduced to 16 per week, a new word had to be invented. This new word was mini-jobs to describe the large number of part-time workers in the UK who cut-back to exactly 16 hours per week. The family tax credit for workers is twice as generous in the UK as in New Zealand.

The blogs so far

part-one-the-labour-leisure-trade-off-and-the-rewards-for-working

part-two-the-labour-supply-effects-of-welfare-benefit-abatement-rate-changes

part-3-abatement-free-income-thresholds-and-labour-supply

part-4-in-work-tax-credits-and-labour-supply

part-5-higher-abatement-rates-and-labour-supply

part-6-mandatory-work-requirements-and-labour-supply

part-7-the-role-of-tagging-in-welfare-benefits-system

Claudia Goldin’s pollution theory of sex discrimination

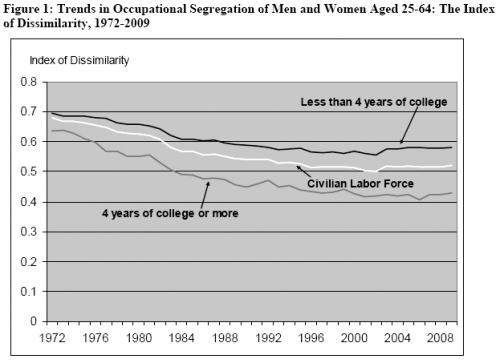
Claudia Goldin argues that it is  difficult to rationalise sex segregation and wage discrimination on the basis of men’s taste for women in the same way as discrimination based on race or ethnicity. Goldin developed a pollution theory of discrimination in which new female hires may reduce the prestige of a previously all-male occupation.

When work took more brawn than brain, the distributions of skills and natural talents of men and women were further apart. Women were not as physically strong as men. This counted for more both before the Industrial Revolution and at the height of the Industrial Revolution when most factory work involved a considerable amount of brawn.

As machines substituted for strength, as brain replaced brawn and as educational attainment increased, the distributions of attributes, skills and natural talents narrowed by sex.

Because there is asymmetric information regarding the value of the characteristic of an individual woman, a new female hire may reduce the prestige of a previously all-male occupation.

Prestige is conferred by some portion of society and is based on the level of a productivity-related characteristic (e.g., strength, skill, education, ability) that originally defines the minimum needed to enter a particular occupation. People had to have a minimum amount of the socially prestigious strength or skill before they are hired.

Male fire fighters or police officers, to take two examples, may perceive their occupational status to depend on the sex composition of their police station or firehouse. These occupations are socially prestigious because of the strength and courage of police and fire-fighters. Men in an all-male occupation might be hostile to allowing a woman to enter their occupation even if the woman meets the qualifications for entry.

A reason for this hostility of the existing male members of the occupation is the rest of society may be slow to learn of the qualifications of these female newcomers. Their entry against this background of ignorance in the wider society  may downgrade the occupation as still carrying prestigious characteristics such as physical strength. As Goldin explains:

Because they feel that the entry of women into their occupations would pollute their prestige or status in that occupation. Very simply, some external group is the arbiter of prestige and status.

Let’s take an example of firemen, and let’s say we begin not that long ago when there were no women who were firemen—which is why they’re called firemen.

And to become a fireman you have to take a test, lifting a very heavy hose and running up many flights of stairs. And every night, the firemen get off from work and go to the local bar.

Everyone slaps them on the back and says what great brawny guys they are and what a great occupation they are in, and everybody knows that to be a fireman requires certain brawny traits and lots of courage.

But nobody knows when there’s a technological shock to this occupation. And in this case it might be that fire hoses become really light or the local fire department changes the test. There are information asymmetries. But they do note that for this “brawny” characteristic, the median woman is much lower.

So if we observe a woman entering the occupation and we don’t know how to judge women, we’re going to assume that her skills are those of the median woman. Or it may be that we can observe something having to do with her muscles and that may up it a little bit.

But chances are we’re going to assume that some technological shock has happened to this occupation. And so her entry into the occupation is going to pollute it.

Then when they go to the bar, people will say, “oh you’ve got a woman in the firehouse; now fire fighting has become women’s work.” That’s where the pollution comes in.

Union rules also played a role in preventing the entry of women into some occupations

Many occupations have changed sex over time e.g., librarians, bank tellers, teachers, telephone operators, and sales positions. New occupations  and industries are less like to be segregated on the basis of sex  because they have not developed a social image regarding the prestige of workers.

Occupational segregation came to an end because credentialisation, which spreads information about individual women’s productivities and shatters old stereotypes, can help expunge this pollution of the prestige of specific occupations and jobs both within the industry and in wider society .

The visibility successful women today and in the past may help shatter old stereotypes and increase knowledge about the true distribution of female attributes in this prestigious occupation.

Goldin found that  when typists were primarily men, it was claimed that typing required physical stamina so woman need not apply.

But later, when the occupational sex segregation reversed, when typing became a female occupation, it was said that typing required a woman’s dexterity, which men did not have! When I was at school, only women were taught to type.

Bryan Caplan on the deserving and undeserving poor

Image

How to End the Gender Pay Gap Once and for All

Image

Trends in Income Inequality and its Impact on Economic Growth – OECD working paper (9 December 2014) – updated

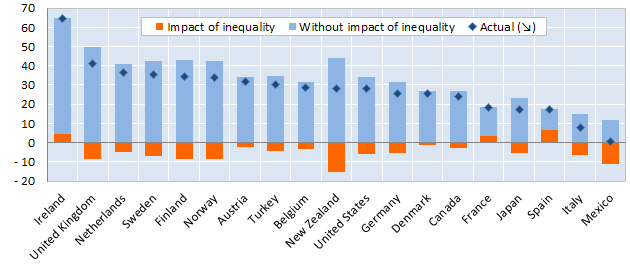
Figure 1: Estimated consequences of changes in inequality (1985 – 2005) on subsequent cumulative growth (1990-2010)

image

Drawing on harmonised data covering the OECD countries over the past 30 years, the econometric analysis suggests that income inequality has a negative and statistically significant impact on subsequent growth.

In particular, what matters most is the gap between low income households and the rest of the population.

In contrast, no evidence is found that those with high incomes pulling away from the rest of the population harms growth.

The paper also evaluates the “human capital accumulation theory” finding evidence for human capital as a channel through which inequality may affect growth.

Analysis based on micro data from the Adult Skills Survey (PIAAC) shows that increased income disparities depress skills development among individuals with poorer parental education background, both in terms of the quantity of education attained (e.g. years of schooling), and in terms of its quality (i.e. skill proficiency).

Educational outcomes of individuals from richer backgrounds, however, are not affected by inequality.

via Trends in Income Inequality and its Impact on Economic Growth – Papers – OECD iLibrary.

The OECD analysis published overnight in Paris suggest that the increase in equality in New Zealand the late 1980s is still scarring economic growth today by about 15 percentage points in lost cumulative economic growth.

The analysis of the OECD  published overnight depends crucially upon how greater inequality reduces the ability of the lower income families to invest in human capital:

The evidence strongly suggests that high inequality hinders the ability of individuals from low economic background to invest in their human capital, both in terms of the level of education but even more importantly in terms of the quality of education.

The OECD theory of inequality and lower growth is there is a financing constraint because of inequality that reduces economic growth because of less human capital accumulation by lower income families.

This is interesting because in 2002, with Pedro Carneiro, James Heckman showed that lack of credit is not a major constraint on the ability of young Americans to attend college. They found that credit constraints prevent, at most, 4% of the U.S. population from attending. Credit constraints is weakening as a rationale for a lack of an accumulation of human capital, and can be easily solved.

The OECD is putting a lot of their growth inequality nexus eggs in one basket. That student loans and other government interventions are not closing credit constraints on financing higher education.

To add to that basket , they are placing a lot of weight in human capital as a driver of growth, and in New Zealand’s case,  of technology absorption, which is a main foundation of economic growth in New Zealand. The evidence that human capital is a key contributor  to higher economic growth is weakening ruck rather than strengthening.

The trend rate of productivity growth did not accelerate over the 20th century despite a massive rise in investments in human capital and R&D because of the rising cost of discovering and adapting new technological knowledge. The number of both R&D workers and highly educated workers increased many-fold over the 20th century in New Zealand and other OECD member countries including the global industrial leaders such as the USA, Japan and major EU member states.

Higher education has been free for the low income families for several generations. Student loans are readily available. It is hard to believe that such a readily solvable problem is a major source of inequality and lower growth.

Cross-country differences in total factor productivity are due to differences in the technologies that are actually used by a country and the degree in the efficiency with which these technologies are used. Differences in total factor productivity, rather than differences in the amount of human capital or physical capital per worker explain the majority of cross-country differences in per capita real incomes (Lucas 1990; Caselli 2005; Prescott 1998; Hall and Jones 1999; Jones and Romer 2010).

Differences in the skills of the individual worker or in the total stock of human capital of all workers in a country cannot explain  cross national differences in value added per worker at the industry level.

  • The USA competes with Japan for productivity leadership in many manufacturing industries.
  • The Japanese services sector productivity can be as little as a one-third of that of the USA.
  • Japanese labour productivity is almost twice Germany’s in producing automobiles and is better that Germany by a large margin for many other manufactured goods.
  • The USA is uniformly more productive in services sector labour productivity. For example, British, French and German telecom workers were 38 to 56 per cent as productive as their American counter-parts.

The USA, Japan, France, the UK and Germany all have relatively well-educated, experienced and tested labour forces. For example, the 1993 McKinsey’s study inquired into the education and skills levels of Japanese and German steel workers. Comparably skilled German steel workers were half as productive as their Japanese counterparts (Prescott and Parente 2000, 2005).

As for the source of the growing income inequality, there is a long literature dating back 25-years arguing that skill-biased technological change is increasing the returns to investing in education

Important is the OECD conclusion that inequality in terms of the rich getting richer does not harm growth. To make sure I have not misquoted them , I quote once again from their abstract, where the OECD summarises its own findings:

Drawing on harmonised data covering the OECD countries over the past 30 years, the econometric analysis suggests that income inequality has a negative and statistically significant impact on subsequent growth.

In particular, what matters most is the gap between low income households and the rest of the population.

In contrast, no evidence is found that those with high incomes pulling away from the rest of the population harms growth.

That  conclusion of the OECD  almost saves me from having to go on about how inequality has not increased in New Zealand for the last 20 years, see figure 2, and that the top 1% have not increased their share of income in recent decades  – see figure 3. The fact that the rich can get richer without harming the poor is an important conclusion that will surely not be reported by the media.

Figure 2: Gini coefficient New Zealand 1980-2015

Figure 3: Top 1% income shares, USA, New Zealand and Australia, 1970-2012

Another inconvenience for the OECD is the last major increase in Gini coefficient in New Zealand was followed by a 15 year economic firm – see figures 2 and 4.

Figure 4: Real GDP per New Zealander and Australian aged 15-64, converted to 2013 price level with updated 2005 EKS purchasing power parities, 1956-2013

The NZ top 1% share has been steady at 8-9% since the mid-1990s  see figure 4; the top 1%’s share rose strongly in the USA in recent decades, from 13% in the mid-1980s to 19% in 2012.

The Occupy crowd blame everything from the global financial crisis to a bad environment on growing inequality and the growing riches of living top 1%. Such an argument has no foundation in fact in New Zealand. The last major increase in Inequality was a long time ago in New Zealand.

The OECD is also rather casual about how policies to redistribute wealth and increasing incomes. While Western Europe is diverse, as a group, the higher taxes  in the European Union reduced incentives to work. Employment as a percentage of the population has been consistently lower in Western Europe than in the USA since the 1950s, with an average employment rate gap of 10 percentage points over 1980-2007.

Large increases in taxes on income from labour since the 1970s, enhanced incentives for retire early, and the interaction of generous employment insurance with the larger skill losses among workers displaced by the greater economic turbulence since 1980 all acted to reduce both real GDP and hours worked per week per working age person by up to a third in Western Europe as compared to the USA since the 1970s (Prescott 2004, 2007; Rogerson 2006, 2008; Ohanian et al. 2008; Ljungqvist and Sargent 1998, 2007, 2008). For example, Ohanian, Rao and Rogerson 2008 in “Work and taxes: allocation of time in OECD countries” found that:

  1. A steep decline in average hours worked per adult and large variations across OECD member countries in the magnitude of this decline.
  2. Changes in labour taxes accounted for a large share of the trend differences.
  3. Countries with high tax rates devote less time to market work, but more time to home activities, such as cooking and cleaning.
  4. This reallocation of time from market work to home work is much stronger for females than for males.

Europeans pay more taxes, work fewer hours per year, have longer vacations, retire sooner, and invest less in human capital in an era in which trends in technology have significantly increased the demand for skilled workers, more innovation, more intense competition and greater entrepreneurial alertness. In The Impact of Labor Taxes on Labor Supply: An International Perspective (AEI Press, 2010) Rogerson finds that:

• a 10 percentage point increase in the tax rate on labour leads to a 10 to 15 per cent decrease in hours of work.
• Even a 5 per cent decrease in hours worked would mean a decline in labour output equating to a serious recession.
• While recessions are temporary, permanent changes in government spending patterns have long-lasting repercussions.
• Although government spending provides citizens with important benefits, such benefits must be weighed against the disincentive effects of increased labour taxes.
• Policymakers who fail to account for the decrease in labour output risk expanding government programs beyond their optimal scale.

Robert Lucas estimated in 1990 that eliminating all taxes on income from capital would increase the U.S. capital stock by about 35% and consumption by 7%.

Hans Fehr, Sabine Jokisch, Ashwin Kambhampati, and Laurence J. Kotlikoff (2014) found that eliminating the corporate income tax completely would raise the U.S. capital stock (machines and buildings) by 23%, output by 8% and the real wages of unskilled and skilled workers each by 12%.

In summary, this one paper by the OECD, which is a working paper makes profound conclusions about taxation and economic growth that contradict a large literature based on the lack of statistical significance of coefficients in the OECD’s regressions.

More fundamentally, linking lower economic growth to inequality through credit constraints on the human capital accumulation of the lower middle class is a weak reed to hang its argument. Human capital is not a good explanation of variations in growth across time or between countries.

What happened to income inequality in New Zealand in the late 1980s is not a credible explanation for lower growth 30 years later. Lower economic growth because of greater inequality is certainly an easy problem to solve if all that is required is more action on the financing constraint on human capital accumulation.

The one main cause of rising child poverty in New Zealand since the 1980s

Image

How Some Women Benefit From Marrying a Man Who Makes Less Money – The Atlantic

marry poor chart.png

The large and growing gap is not due to timid female MBAs.

Some of it is attributed to different skills, jobs before the MBA, and that male business students typically take more finance classes and women more marketing classes.

But a majority of the difference is due to women taking time out of the labor force and then working less after having children.

Women without children usually don’t take time off, and most of their earnings disparity with men can be explained by differences in their skills.

It’s notable that the earnings of some women did not fall very much after they had children and any drop in income did not persist after a few years.

But these women often had a “lower” earning spouse (income under $100,000). A large and sustained drop in income is highly correlated with having children and a high-earning husband.

via How Some Women Benefit From Marrying a Man Who Makes Less Money – The Atlantic.

Poverty and Behavior: Bryan Caplan

  • alcoholism: Alcohol costs money, interferes with your ability to work, and leads to expensive reckless behavior.
  • drug addiction: Like alcohol, but more expensive, and likely to eventually lead to legal troubles you’re too poor to buy your way out of.
  • single parenthood: Raising a child takes a lot of effort and a lot of money.  One poor person rarely has enough resources to comfortably provide this combination of effort and money.
  • unprotected sex: Unprotected sex quickly leads to single parenthood.  See above.
  • dropping out of high school: High school drop-outs earn much lower wages than graduates.  Kids from rich families may be able to afford this sacrifice, but kids from poor families can’t.
  • being single: Getting married lets couples avoid a lot of wasteful duplication of household expenses.  These savings may not mean much to the rich, but they make a huge difference for the poor.
  • non-remunerative crime: Drunk driving and bar fights don’t pay.  In fact, they have high expected medical and legal expenses.  The rich might be able to afford these costs.  The poor can’t.

Yet as Charles Murray keeps reminding us, all of the pathologies on my list are especially prevalent among the poor.

via Poverty and Behavior: Generalizing Yglesias, Bryan Caplan | EconLog | Library of Economics and Liberty.

Super-Economy: The class struggle in one picture again

via Super-Economy: The class struggle in one picture.

White Names vs. Black Names: Roland Fryer

The shape of the welfare state in the USA

For able-bodied adults, there is limited help in lean times.

One in five Americans on Medicaid; this image does not include those on Medicare –those over 65 who get their healthcare paid by the government.

Image


Previous Older Entries Next Newer Entries

Arin’s Substack

Celebrating humanity's flourishing through the spread of capitalism and the rule of law

David Andolfatto

Celebrating humanity's flourishing through the spread of capitalism and the rule of law

Monetary Non-Neutrality

Celebrating humanity's flourishing through the spread of capitalism and the rule of law

Reason Magazine

Celebrating humanity's flourishing through the spread of capitalism and the rule of law

Coyote Blog

Celebrating humanity's flourishing through the spread of capitalism and the rule of law

Thoughts from the North

Celebrating humanity's flourishing through the spread of capitalism and the rule of law

Fardels Bear

A History of the Alt-Right

Vincent Geloso

Econ Prof at George Mason University, Economic Historian, Québécois

Bassett, Brash & Hide

Celebrating humanity's flourishing through the spread of capitalism and the rule of law

Truth on the Market

Scholarly commentary on law, economics, and more

The Undercover Historian

Beatrice Cherrier's blog

Matua Kahurangi

Celebrating humanity's flourishing through the spread of capitalism and the rule of law

Temple of Sociology

Celebrating humanity's flourishing through the spread of capitalism and the rule of law

Velvet Glove, Iron Fist

Celebrating humanity's flourishing through the spread of capitalism and the rule of law

Why Evolution Is True

Why Evolution is True is a blog written by Jerry Coyne, centered on evolution and biology but also dealing with diverse topics like politics, culture, and cats.

NoTricksZone

Celebrating humanity's flourishing through the spread of capitalism and the rule of law

Homepaddock

A rural perspective with a blue tint by Ele Ludemann

Kiwiblog

DPF's Kiwiblog - Fomenting Happy Mischief since 2003

The Dangerous Economist

Celebrating humanity's flourishing through the spread of capitalism and the rule of law

Watts Up With That?

The world's most viewed site on global warming and climate change

The Logical Place

Tim Harding's writings on rationality, informal logic and skepticism

Doc's Books

A window into Doc Freiberger's library

The Risk-Monger

Let's examine hard decisions!

Uneasy Money

Commentary on monetary policy in the spirit of R. G. Hawtrey

Barrie Saunders

Thoughts on public policy and the media

Liberty Scott

Celebrating humanity's flourishing through the spread of capitalism and the rule of law

Point of Order

Politics and the economy

James Bowden's Blog

A blog (primarily) on Canadian and Commonwealth political history and institutions

Science Matters

Reading between the lines, and underneath the hype.

Peter Winsley

Economics, and such stuff as dreams are made on

A Venerable Puzzle

"The British constitution has always been puzzling, and always will be." --Queen Elizabeth II

The Antiplanner

Celebrating humanity's flourishing through the spread of capitalism and the rule of law

Bet On It

Celebrating humanity's flourishing through the spread of capitalism and the rule of law

History of Sorts

WORLD WAR II, MUSIC, HISTORY, HOLOCAUST

Roger Pielke Jr.

Undisciplined scholar, recovering academic

Offsetting Behaviour

Celebrating humanity's flourishing through the spread of capitalism and the rule of law

JONATHAN TURLEY

Res ipsa loquitur - The thing itself speaks

Conversable Economist

In Hume’s spirit, I will attempt to serve as an ambassador from my world of economics, and help in “finding topics of conversation fit for the entertainment of rational creatures.”

The Victorian Commons

Researching the House of Commons, 1832-1868

The History of Parliament

Articles and research from the History of Parliament Trust

Books & Boots

Reflections on books and art

Legal History Miscellany

Posts on the History of Law, Crime, and Justice

Sex, Drugs and Economics

Celebrating humanity's flourishing through the spread of capitalism and the rule of law

European Royal History

Exploring the Monarchs of Europe

Tallbloke's Talkshop

Cutting edge science you can dice with

Marginal REVOLUTION

Small Steps Toward A Much Better World