The politics of ethnicity-based research in New Zealand

When Simon Chapple in 2000 wrote “Māori Socio-Economic Disparity”, which showed that disadvantage in New Zealand is more closely tied to age, marital status, education, skills, and geographic location than it is to ethnicity, broadly conceived, such as Māori ethnicity:

  • He was summoned before the Māori Affairs Committee of parliament to defend his paper! His chief executive at the Ministry of Social Policy went along with him to defend what he wrote while employed as a senior analyst at the Department of Labour. Staff at his new ministry launched a petition to have Simon fired.
  • The head of the Māori Affairs Ministry accused Simon of breaching the public service code of conduct.

Chapple also found that there are important differences in socio economic development by Māori self-identity. Those who identified only as Māori did worse than those that are identified as Māori and another ethnicity. Identifying only as Māori also correlated with living in rural New Zealand.

In terms of employment discrimination, employers would not know whether a Māori job applicant identified as only as Māori or also with another ethnicity, so discrimination is not a good explanation of Māori disadvantage because of this counterfactual. A major driver of Māori disadvantage, which is identifying on the Census form solely as Maori, is simply unknown to discriminating employers as a basis for discrimination in hiring and promotion.

There were editorials in the Dominion Post, which I cannot find online,  and in the New Zealand Herald. The latter said:

The Government is being prodded to recognise that Maori deprivation has more to do with socio-economic factors than ethnicity.

This was the conclusion of a report by the Labour Department’s senior research analyst, Simon Chapple. Helen Clark might well have had that finding partly in mind when she referred to a lot of water having gone under the bridge since the Government first formulated legislation.

Mr Chapple said, in essence, that place of residence, age, education and skills had more to do with poverty than race. In areas such as South Auckland, Northland and the central North Island, there were poor Maori, but there were also poor Pākehā and poor Pasifika.

The Minister attacked him and the paper as well for contradicting the Minister’s claim during the election campaign that everything got worse for Maori in the 1990s.

image

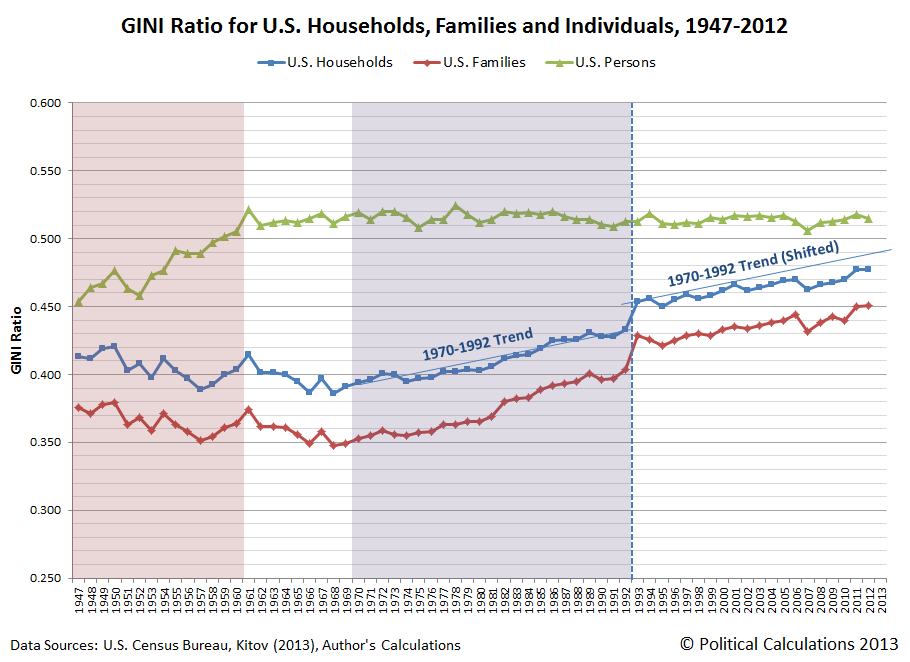
Real equivalised median household income rose 47% from 1994 to 2010; for Māori, this rise was 68%; for Pasifika, 77% (Perry July 2014)

See Karen Baehler’s Ethnicity-based research and politics: snapshots from the United States and New Zealand for more information and a comparison with the similar response to Daniel Patrick Moynihan’s The Negro Family: A Case for National Action in 1965.

About a quarter of Negro families are headed by women. The divorce rate is about 2 1/2 times what it is [compared with whites],” Moynihan said. “The number of fatherless children keeps growing. And all these things keep getting worse, not better, over recent years.”

Moynihan, now retired from the United States Senate, was a senior official in LBJ’s Labor Department in 1965. He wrote his report on a typewriter over a few weeks and had the publications office in the basement of the Labor Department print 100 of them, marked “For Official Use Only.”

  • He warned about the breakdown of the African-American family where deprivation and disorganisation had formed their own vicious circle.
  • Many civil rights leaders had labelled Moynihan’s report a subtle form of racism because of its unflattering portrayal of the black family (Wilson 1987).
  • These accusations of racism helped make the breakdown of the family a taboo subject in social policy in the USA

see The Moynihan Report Revisited: Lessons and Reflections after Four Decades for a review by the best and the brightest in American economics and sociology on Daniel Patrick Moynihan’s prophetic warnings. Holzer says, for  example:

Moynihan was extremely insightful and even prescient in arguing that the employment situation of young black men was a “crisis . . . that would only grow worse.”

He understood that these trends involve both limits on labour market opportunities that these young men face as well as skill deficits of and behavioural responses by the young men themselves.

More children are growing-up without a working father living in the home and glean the awareness that work is a central expectation of adult life (Wilson 1987, 1996).

Single-parent households increased from 13 per cent of all Māori households in 1981 to 24.4 per cent in the 2006 Census. In the 2006 Census, 70 per cent of Māori single parent households were on a low income compared to 15 per cent of other Māori one family households (Kiro, Randow and Sporle 2010).

Most of the skill gaps that are present at the age of 18 – skill gaps which substantially explain gaps in adult earnings and employment in all groups – are also present at the age of five (Cunha and Heckman 2007). There is much evidence to show that disadvantaged children have lower levels of soft skills (non-cognitive skills): motivation, persistence, self-discipline, the ability to work with others, the ability to defer gratification and plan ahead, etc. (Heckman 2008). Most of the skills that are acquired at school build on these soft skills that are moulded and reinforced within whānau.

When I started working on labour economics in 2007 I found that the labour economics of Māori was very narrowly written and stayed well clear of the minefield that Simon braved about how ethnicity does not matter that much to Māori social disadvantage.

The Far Left view of the welfare state

HT: Dan Mitchell

Forget income inequality, lets go after zoning restrictions…


via Managerial Econ: Forget income inequality, lets go after zoning restrictions….

Image

Thatcher’s brilliant critique of socialism and how it is happy for the poor to be poor

alt

Household Incomes in NZ: trends in indicators of inequality and hardship 1982-2013

Real household income trends, 1982 to 2013 ($2013) before housing costs (BHC) and after housing costs (AHC)

real household income 1982-2013

Gini coefficient 1980 – 2015

gini coefficient 1980 2015

The tax and transfer system significantly reduces the inequality

The tax and transfer system significantly reduces the inequality

image

the increases were 55% for Pakeha, 57% for Pasifika, and 64% for Māori since 1994.

Female voting demographics and the growth of government

The gender gap in voting dates back 2 generations or more and may now be in double digits.

A large share of all social spending is for the care of dependents – everything from children to non-working mothers and old age pensioners. Women support this spending because they benefit more from the social insurance it offers. Women both earn less and are more likely to be out of the workforce caring for children. Women also change their voting patterns more often than men as they marry and divorce or as they become single mothers.

John  Lott pondered on why the government started growing precisely when it did. The federal government, aside from periods of wartime, consumed 2 to 3%  of GDP up until World War I. In the 1920s, non-military federal spending began steadily climbing. FDR’s New Deal continued an earlier trend.

Lott explains the growth of government with women’s suffrage. For decades, polls have shown that women as a group vote differently than men. Without the women’s vote, Republicans would have swept every U.S. presidential race but one between 1968 and 2004.

A major gender gap issue is smaller government and lower taxes, which is a much higher priority for men. Women were more opposed to the 1996 federal welfare reforms, which mandated time limits for receiving welfare and imposed work requirements on welfare recipients.

Women are also supporters of Medicare, Social Security and educational expenditures more than men. Studies show that women are generally more risk-averse than men so they support government programs to ensure against certain risks in life.

  • Women’s average incomes are also slightly lower and less likely to vary so single women prefer more progressive income taxes.
  • Once women marry, they bear a greater share of taxes through their husbands’ relatively higher incomes so their support for high taxes declines.

Marriage also provides an economic explanation for why men and women prefer different policies.

Single women who believe they may marry as well as married women who most fear divorce, look for protection against possible divorce: a more progressive tax system and other government transfers of wealth from rich to poor.

Lott considers that A good way to analyse the direct effect of women’s suffrage on the growth of government is to study how each of the 48 state governments expanded after women obtained the right to vote.

  • Women’s suffrage was first granted in western states seeking women migrants: Wyoming (1869), Utah (1870), Colorado (1893) and Idaho (1896).
  • Women could vote in 29 states before women’s suffrage was achieved nationwide in 1920 with the adoption of the 19th Amendment to the Constitution.

The impact of granting of women’s suffrage was startling: state governments started expanding the first year after women voted and continued growing until real per capita spending more than doubled. The increase in government spending and revenue started immediately after women started voting.

There were 19 states that had not passed women’s suffrage before the approval of the 19th Amendment, nine approved the amendment, while the other 12 had suffrage imposed on them.

If some unknown third factor caused a desire for larger government and women’s suffrage, government should have only grown in states that voluntarily adopted suffrage. After approving women’s suffrage, government grew at a similar pace in both groups of states.

As more women voted and eventually voted in similar numbers as men, the size of state and federal governments expanded as women became an increasingly important part of the electorate. It took up to 30 years for women’s voting participation rate to equal that of men.

Lott also found that women’s political views on average vary more than those of men:

  • Young single women are about 50 per cent more likely to vote Democratic.
  • For married women, this gap is only one-third as large.
  • Married women with children become more conservative still.
  • Women with children who are divorced are suddenly about 75 per cent more likely to vote for Democrats than single men.

Not surprisingly, political parties pitch their platforms to women because they are more likely to change their vote over identifiable issues that are within the scope for government to change or influence

Hayek on the Mirage of Social Justice

Video

The application of John Rawls difference principle to New Zealand

An urban legend in New Zealand is that income inequality is going from bad to worse.

Since the mid 1990s to around 2011 there was a small net fall in New Zealand’s income inequality trend line in the graph for the Gini coefficient for the income distribution for New Zealand shows. inequality in New Zealand is similar to that in Australia, Ireland, Canada and Japan.

gini coefficient nz

Source: Ministry of Social Development (2014)

Taxes and transfers have reduced inequality in New Zealand when measured by Gini coefficients, but the trend is been relatively stable for many years.

gini after income transfer

Source: Ministry of Social Development (2014)

Rawls pointed out that behind the veil of ignorance, people will agree to inequality as long as it is to everyone’s advantage. Rawls was attuned to the importance of incentives in a just and prosperous society. If unequal incomes are allowed, this might turn out to be to the advantage of everyone. Robert Nozick said that:

Political philosophers must now either work within Rawls’s theory or explain why not.

The groups that have been doing best in New Zealand have been Maori and Pasifika. In real terms, overall median household income rose 47% from 1994 to 2010; for Maori, this rise was 68%; for Pacific, 77%!

image

Source: Ministry of Social Development (2014)

The large improvements in Māori incomes since 1992 were based on rising Māori employment rates, fewer Māori on benefits or zero incomes, more Māori moving into higher paying jobs, and greater Māori educational attainment (Dixon and Maré 2007).

Maori unemployment reached a 20-year low of 8 per cent from 2005 to 2008. Labour force  participation by Maori increased from 45% in the late 1980s to about 62%  in the last few years.

Most of the remaining income disparities between Māori and non-Māori flow from differences in educational attainment and demographic and socio-economic characteristics including household composition (Chapple 2000; Maani 2004; Dixon and Maré 2007).

How much of the massive increases in incomes over the last 20 years spread throughout the entire community are you willing to give up for a little more equality? How much of your income will you donate to charity to lead the way?

.

Inequality is in; discrimination is out for Next Generation Left

Question 1

P-P-2014-06-26-typology-4-04

Source: post-partisan

Piketty and Pension Fund Socialism

alt

Any attack on capitalism these days is a direct attack of the retirement savings of ordinary workers. We live in the age of  what Peter Drucker called pension fund socialism in 1976. As Drucker added in 1991:

The rise of pension funds as dominant owners and lenders represents one of the most startling power shifts in economic history.

The first modern pension fund was established in 1950 by General Motors.

Four decades later, pension funds control total assets of $2.5 trillion, divided about equally between common stocks and fixed-income securities. Demographics guarantee that these assets will grow aggressively for at least another ten years.

The majority of equity capital is owned by pension funds and other collective investment vehicles corralling the savings of ordinary people. Much of the rest of physical capital is owned by workers through home ownership.

In the age of human capital, 70-90% of all capital in the economy is human capital. The notion of unskilled workers labouring away with the capital supplied by the bosses is 19th century throwback.

The rentier rich has been long replaced by the working rich. They make their fortunes in their own life times – sometimes as business entrepreneurs, sometimes through rent-seeking.

It is also the age of specific human capital, with a proliferation of technologies and products. The rising specialisation of firms and their production inputs has forced firms to try harder to find those inputs that suit their needs best. Management has the task of finding the right inputs. The role and reward to managers has therefore risen.

When the rise in returns on investments in human capital is beneficial and desirable, and policies designed to deal with inequality must take account of its cause. Growth in education levels has been a significant source of rising wages, productivity, and living standards over the past century.

The initial impact of higher returns to human capital is wider inequality in earnings, but that impact becomes more muted and may be reversed over time as young people invest more in their human capital.

The rentier class has been replaced by the working rich. The evidence on the top 1% is most consistent with theories of superstars, skill biased technological change, greater scale and their interaction of these factors.

Individuals who are really good at making money can now apply their skills to larger amounts of capital and reach far larger audiences  and markets for their products and services. That favours CEOs, athletes, celebrities, corporate lawyers, successful entrepreneurs and other working rich Who have a skill  or talent that can be supplied at little cost on a much larger scale. Some have a special dark place in their hearts for people who earned their money through honest hard work.

The role of equality in subsequently increasing the size of government

Sam Peltzman

Sam Peltzman argues that:

governments grow where groups which share a common interest in that growth and can perceive and articulate that interest become more numerous.

Growth in the size of governmental is driven by the evolving demands of voters. Peltzman maintains that:

the levelling of income differences across a large part of the population . . . has in fact been a major source of the growth of government in the developed world over the last fifty years [because this levelling created] a broadening of the political base that stood to gain from redistribution generally and thus provided a fertile source of political support for expansion of specific programs. At the same time, these groups became more able to perceive and articulate that interest . . this simultaneous growth of “ability” served to catalyse politically the spreading economic interest in redistribution

Growing income equality, which was a result of the Industrial Revolution and modern economic growth, caused the size of government to then grow. The reduction in inequality preceded the rise of the welfare state in the mid-20th century.

Democratic socialism is pointless

Democratic socialism is pointless because electoral power is fleeting: sooner or later, the left wing parties representing the socialist alternative lose power, and capitalism is resorted.

How can democratic socialism work without entertaining the certain prospects of the right-wing parties winning office in 6,9, 12 years time and undoing everything?

Under pension fund socialism, with the majority of the share market owned by superannuation funds, any call for wide-spread nationalisations is political suicide. The same for re-nationalisation later when the left-parties get another turn in office.

The rotation of power is common in democracies, and the worst rise to the top. So it is wise to design constitutional safeguards to minimise the damage done when those crazies to the right or left of you get their chance in office, as they will.

Socialists must choose between supporting democracy and supporting socialism. The only way to stop the return for capitalism would be to undermine elections and the rule of law and ignore constitutional rights.

Unfettered power loses its shine when it must be shared with your political opponents at least once a decade.

Too many policies and ideas of the Left assumed that they are the face of the future, rather than just another political party that will hold power as often as not.

As James Buchanan pointed out in 1954, the great strength of democracies is majorities are temporary so the exploitation by the majority of the minority is never permanent. If electoral majorities are other than temporary, the minority would have no choice but to fight.

Political Calculations: The Major Trends in U.S. Income Inequality Since 1947

via Political Calculations: The Major Trends in U.S. Income Inequality Since 1947.

The Samaritan’s public choice dilemma

HT: The Town Crier

Sam Peltzman and the great restraint in the growth of government, 1980-2007

From 1950 to 1980 the size of government doubled in the developed world and then stopped dead in 1980. This great restraint on the growth of government happened everywhere. It was not just Thatcher’s Britain or Reagan’s America. It was everywhere, in France and Germany, and even in Scandinavia.

Peltzman’s data below has government spending double between 1950 and 1980, and then nothing much happened in between 1980 and 2007 – the size of government is pretty flat as a share of GDP for 27 years.

Source: Sam Peltzman, The Socialist Revival? (2012).

There is a noticeable reduction in the size of government spending in Scandinavia. Reagan and Thatcher had nothing on those Social Democrats in Scandinavia when it comes to cutting the size of government.

Governments everywhere hit a brick wall in terms of their ability to raise further tax revenues. Political parties of the Left and Right recognised this new reality.

Government spending grew in many countries in the 20th century because of demographic shifts, more efficient taxes, more efficient spending, a shift in the political power from those taxed to those subsidised, shifts in political power among taxed groups, and shifts in political power among subsidised groups.

The median voter in all countries was alive to the power of incentives and to not killing the goose that laid the golden egg.

After 1980, the taxed, regulated and subsidised groups had an increased incentive to converge on new lower cost modes of redistribution.

More efficient taxes, more efficient spending, more efficient regulation and a more efficient state sector reduced the burden of taxes on the taxed groups.

Most subsidised groups benefited as well because their needs were met in ways that provoked less political opposition.

Gary Becker made this warning about the political repercussions of tax reform and economic reform in general for the size of government:

…the greater efficiency of a VAT and its ease of collection is a two-edged sword.

On the one hand, it would raise a given amount of tax revenue efficiently and cheaply.

Since economists usually evaluate different types of taxes by their efficiency and ease of collecting a given amount of tax revenue, economists typically like value added taxes.

The error in this method of evaluating taxes is that it does not consider the political economy determinants of the level of taxes.

From this political economy perspective, the value added tax does not look so attractive, at least to those of us who worry that governments would spend and tax at higher levels than is economically and socially desirable.


Reforms ensued after 1980 led by parties on the Left and Right, with some members of existing political groupings benefiting from joining new political coalitions.

The deadweight losses of taxes, transfers and regulation limit inefficient policies and the sustainability of redistribution.

Peltzman likes to note that at the start of the 20th century, the United States government was about 8% of GDP. The two largest programs were education and highways. The post office was as big as the military.

Government is about five times that now with defence, health, education and income security accounting for 70% of this total. Peltzman makes the very interesting point that:

There is no new program in the political horizon that seems capable of attaining anything like the size of any of these four.

For the time being the future government rest on the extent of existing mega programs.

Health and income security account for 55% of total government spending in the OECD. It is in these two programs where the future of the growth of government lie.

The pressure for that growth in government will come from the elderly. Governments will have to choose between high taxes on the young to fund these programs for the elderly or find other options.

Previous Older Entries Next Newer Entries

Bassett, Brash & Hide

Celebrating humanity's flourishing through the spread of capitalism and the rule of law

Truth on the Market

Scholarly commentary on law, economics, and more

The Undercover Historian

Beatrice Cherrier's blog

Matua Kahurangi

Celebrating humanity's flourishing through the spread of capitalism and the rule of law

Temple of Sociology

Celebrating humanity's flourishing through the spread of capitalism and the rule of law

Velvet Glove, Iron Fist

Celebrating humanity's flourishing through the spread of capitalism and the rule of law

Why Evolution Is True

Why Evolution is True is a blog written by Jerry Coyne, centered on evolution and biology but also dealing with diverse topics like politics, culture, and cats.

Down to Earth Kiwi

Celebrating humanity's flourishing through the spread of capitalism and the rule of law

NoTricksZone

Celebrating humanity's flourishing through the spread of capitalism and the rule of law

Homepaddock

A rural perspective with a blue tint by Ele Ludemann

Kiwiblog

DPF's Kiwiblog - Fomenting Happy Mischief since 2003

The Dangerous Economist

Celebrating humanity's flourishing through the spread of capitalism and the rule of law

Watts Up With That?

The world's most viewed site on global warming and climate change

The Logical Place

Tim Harding's writings on rationality, informal logic and skepticism

Doc's Books

A window into Doc Freiberger's library

The Risk-Monger

Let's examine hard decisions!

Uneasy Money

Commentary on monetary policy in the spirit of R. G. Hawtrey

Barrie Saunders

Thoughts on public policy and the media

Liberty Scott

Celebrating humanity's flourishing through the spread of capitalism and the rule of law

Point of Order

Politics and the economy

James Bowden's Blog

A blog (primarily) on Canadian and Commonwealth political history and institutions

Science Matters

Reading between the lines, and underneath the hype.

Peter Winsley

Economics, and such stuff as dreams are made on

A Venerable Puzzle

"The British constitution has always been puzzling, and always will be." --Queen Elizabeth II

The Antiplanner

Celebrating humanity's flourishing through the spread of capitalism and the rule of law

Bet On It

Celebrating humanity's flourishing through the spread of capitalism and the rule of law

History of Sorts

WORLD WAR II, MUSIC, HISTORY, HOLOCAUST

Roger Pielke Jr.

Undisciplined scholar, recovering academic

Offsetting Behaviour

Celebrating humanity's flourishing through the spread of capitalism and the rule of law

JONATHAN TURLEY

Res ipsa loquitur - The thing itself speaks

Conversable Economist

In Hume’s spirit, I will attempt to serve as an ambassador from my world of economics, and help in “finding topics of conversation fit for the entertainment of rational creatures.”

The Victorian Commons

Researching the House of Commons, 1832-1868

The History of Parliament

Articles and research from the History of Parliament Trust

Books & Boots

Reflections on books and art

Legal History Miscellany

Posts on the History of Law, Crime, and Justice

Sex, Drugs and Economics

Celebrating humanity's flourishing through the spread of capitalism and the rule of law

European Royal History

Exploring the Monarchs of Europe

Tallbloke's Talkshop

Cutting edge science you can dice with

Marginal REVOLUTION

Small Steps Toward A Much Better World

NOT A LOT OF PEOPLE KNOW THAT

“We do not believe any group of men adequate enough or wise enough to operate without scrutiny or without criticism. We know that the only way to avoid error is to detect it, that the only way to detect it is to be free to inquire. We know that in secrecy error undetected will flourish and subvert”. - J Robert Oppenheimer.

STOP THESE THINGS

The truth about the great wind power fraud - we're not here to debate the wind industry, we're here to destroy it.

Lindsay Mitchell

Celebrating humanity's flourishing through the spread of capitalism and the rule of law

Alt-M

Celebrating humanity's flourishing through the spread of capitalism and the rule of law

croaking cassandra

Economics, public policy, monetary policy, financial regulation, with a New Zealand perspective

The Grumpy Economist

Celebrating humanity's flourishing through the spread of capitalism and the rule of law

International Liberty

Restraining Government in America and Around the World