The application of John Rawls difference principle to New Zealand
07 Jul 2014 Leave a comment
in applied price theory, income redistribution, politics - New Zealand, Rawls and Nozick Tags: difference principle, income distribution, John Rawls, Maori economic development, Pasifika economic development
An urban legend in New Zealand is that income inequality is going from bad to worse.
Since the mid 1990s to around 2011 there was a small net fall in New Zealand’s income inequality trend line in the graph for the Gini coefficient for the income distribution for New Zealand shows. inequality in New Zealand is similar to that in Australia, Ireland, Canada and Japan.

Source: Ministry of Social Development (2014)
Taxes and transfers have reduced inequality in New Zealand when measured by Gini coefficients, but the trend is been relatively stable for many years.

Source: Ministry of Social Development (2014)
Rawls pointed out that behind the veil of ignorance, people will agree to inequality as long as it is to everyone’s advantage. Rawls was attuned to the importance of incentives in a just and prosperous society. If unequal incomes are allowed, this might turn out to be to the advantage of everyone. Robert Nozick said that:
Political philosophers must now either work within Rawls’s theory or explain why not.
The groups that have been doing best in New Zealand have been Maori and Pasifika. In real terms, overall median household income rose 47% from 1994 to 2010; for Maori, this rise was 68%; for Pacific, 77%!

Source: Ministry of Social Development (2014)
The large improvements in Māori incomes since 1992 were based on rising Māori employment rates, fewer Māori on benefits or zero incomes, more Māori moving into higher paying jobs, and greater Māori educational attainment (Dixon and Maré 2007).
Maori unemployment reached a 20-year low of 8 per cent from 2005 to 2008. Labour force participation by Maori increased from 45% in the late 1980s to about 62% in the last few years.
Most of the remaining income disparities between Māori and non-Māori flow from differences in educational attainment and demographic and socio-economic characteristics including household composition (Chapple 2000; Maani 2004; Dixon and Maré 2007).
How much of the massive increases in incomes over the last 20 years spread throughout the entire community are you willing to give up for a little more equality? How much of your income will you donate to charity to lead the way?
.
Inequality is in; discrimination is out for Next Generation Left
02 Jul 2014 1 Comment
in applied price theory, income redistribution, politics - USA, Public Choice, Rawls and Nozick Tags: discrimination, inequality, Leftover Left, poverty, The Progressive Left


Piketty and Pension Fund Socialism
01 Jul 2014 1 Comment
in financial economics, human capital, income redistribution, rentseeking Tags: pension fund socialism, Peter Drucker, Piketty

Any attack on capitalism these days is a direct attack of the retirement savings of ordinary workers. We live in the age of what Peter Drucker called pension fund socialism in 1976. As Drucker added in 1991:
The rise of pension funds as dominant owners and lenders represents one of the most startling power shifts in economic history.
The first modern pension fund was established in 1950 by General Motors.
Four decades later, pension funds control total assets of $2.5 trillion, divided about equally between common stocks and fixed-income securities. Demographics guarantee that these assets will grow aggressively for at least another ten years.
The majority of equity capital is owned by pension funds and other collective investment vehicles corralling the savings of ordinary people. Much of the rest of physical capital is owned by workers through home ownership.
In the age of human capital, 70-90% of all capital in the economy is human capital. The notion of unskilled workers labouring away with the capital supplied by the bosses is 19th century throwback.
The rentier rich has been long replaced by the working rich. They make their fortunes in their own life times – sometimes as business entrepreneurs, sometimes through rent-seeking.
It is also the age of specific human capital, with a proliferation of technologies and products. The rising specialisation of firms and their production inputs has forced firms to try harder to find those inputs that suit their needs best. Management has the task of finding the right inputs. The role and reward to managers has therefore risen.
When the rise in returns on investments in human capital is beneficial and desirable, and policies designed to deal with inequality must take account of its cause. Growth in education levels has been a significant source of rising wages, productivity, and living standards over the past century.
The initial impact of higher returns to human capital is wider inequality in earnings, but that impact becomes more muted and may be reversed over time as young people invest more in their human capital.
The rentier class has been replaced by the working rich. The evidence on the top 1% is most consistent with theories of superstars, skill biased technological change, greater scale and their interaction of these factors.
Individuals who are really good at making money can now apply their skills to larger amounts of capital and reach far larger audiences and markets for their products and services. That favours CEOs, athletes, celebrities, corporate lawyers, successful entrepreneurs and other working rich Who have a skill or talent that can be supplied at little cost on a much larger scale. Some have a special dark place in their hearts for people who earned their money through honest hard work.
The role of equality in subsequently increasing the size of government
30 Jun 2014 Leave a comment
in income redistribution, Public Choice, Sam Peltzman Tags: growth in government

Sam Peltzman argues that:
governments grow where groups which share a common interest in that growth and can perceive and articulate that interest become more numerous.
Growth in the size of governmental is driven by the evolving demands of voters. Peltzman maintains that:
the levelling of income differences across a large part of the population . . . has in fact been a major source of the growth of government in the developed world over the last fifty years [because this levelling created] a broadening of the political base that stood to gain from redistribution generally and thus provided a fertile source of political support for expansion of specific programs. At the same time, these groups became more able to perceive and articulate that interest . . this simultaneous growth of “ability” served to catalyse politically the spreading economic interest in redistribution
Growing income equality, which was a result of the Industrial Revolution and modern economic growth, caused the size of government to then grow. The reduction in inequality preceded the rise of the welfare state in the mid-20th century.
Democratic socialism is pointless
22 Jun 2014 Leave a comment
in F.A. Hayek, income redistribution, Public Choice Tags: democratic socialisim, rotation of power
Democratic socialism is pointless because electoral power is fleeting: sooner or later, the left wing parties representing the socialist alternative lose power, and capitalism is resorted.
How can democratic socialism work without entertaining the certain prospects of the right-wing parties winning office in 6,9, 12 years time and undoing everything?
Under pension fund socialism, with the majority of the share market owned by superannuation funds, any call for wide-spread nationalisations is political suicide. The same for re-nationalisation later when the left-parties get another turn in office.
The rotation of power is common in democracies, and the worst rise to the top. So it is wise to design constitutional safeguards to minimise the damage done when those crazies to the right or left of you get their chance in office, as they will.
Socialists must choose between supporting democracy and supporting socialism. The only way to stop the return for capitalism would be to undermine elections and the rule of law and ignore constitutional rights.

Unfettered power loses its shine when it must be shared with your political opponents at least once a decade.
Too many policies and ideas of the Left assumed that they are the face of the future, rather than just another political party that will hold power as often as not.
As James Buchanan pointed out in 1954, the great strength of democracies is majorities are temporary so the exploitation by the majority of the minority is never permanent. If electoral majorities are other than temporary, the minority would have no choice but to fight.
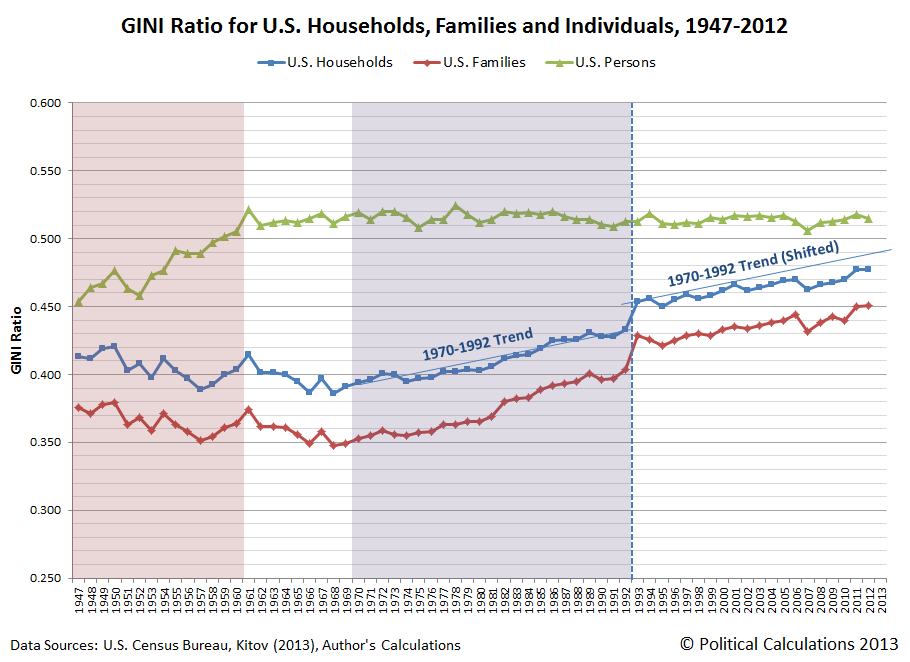
Political Calculations: The Major Trends in U.S. Income Inequality Since 1947
06 Jun 2014 Leave a comment
in income redistribution, labour economics Tags: income inequality
The Samaritan’s public choice dilemma
02 Jun 2014 Leave a comment
in income redistribution, Public Choice, rentseeking Tags: The Samaritan's dilemma

HT: The Town Crier
Sam Peltzman and the great restraint in the growth of government, 1980-2007
01 Jun 2014 Leave a comment
in constitutional political economy, Gary Becker, income redistribution, Public Choice, rentseeking, Sam Peltzman Tags: growth in government, The Great Restraint
From 1950 to 1980 the size of government doubled in the developed world and then stopped dead in 1980. This great restraint on the growth of government happened everywhere. It was not just Thatcher’s Britain or Reagan’s America. It was everywhere, in France and Germany, and even in Scandinavia.
Peltzman’s data below has government spending double between 1950 and 1980, and then nothing much happened in between 1980 and 2007 – the size of government is pretty flat as a share of GDP for 27 years.
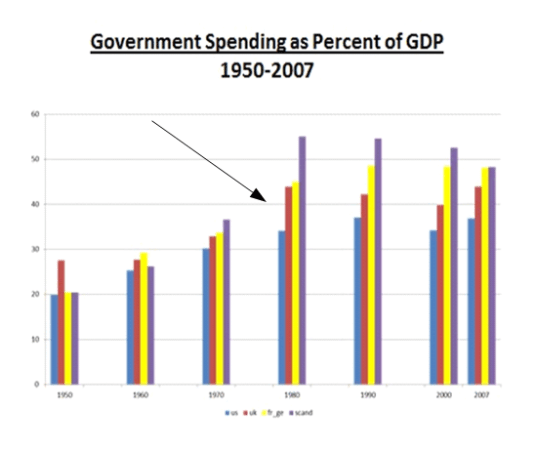
Source: Sam Peltzman, The Socialist Revival? (2012).
There is a noticeable reduction in the size of government spending in Scandinavia. Reagan and Thatcher had nothing on those Social Democrats in Scandinavia when it comes to cutting the size of government.
Governments everywhere hit a brick wall in terms of their ability to raise further tax revenues. Political parties of the Left and Right recognised this new reality.
Government spending grew in many countries in the 20th century because of demographic shifts, more efficient taxes, more efficient spending, a shift in the political power from those taxed to those subsidised, shifts in political power among taxed groups, and shifts in political power among subsidised groups.
The median voter in all countries was alive to the power of incentives and to not killing the goose that laid the golden egg.
After 1980, the taxed, regulated and subsidised groups had an increased incentive to converge on new lower cost modes of redistribution.
More efficient taxes, more efficient spending, more efficient regulation and a more efficient state sector reduced the burden of taxes on the taxed groups.
Most subsidised groups benefited as well because their needs were met in ways that provoked less political opposition.
Gary Becker made this warning about the political repercussions of tax reform and economic reform in general for the size of government:
…the greater efficiency of a VAT and its ease of collection is a two-edged sword.
On the one hand, it would raise a given amount of tax revenue efficiently and cheaply.
Since economists usually evaluate different types of taxes by their efficiency and ease of collecting a given amount of tax revenue, economists typically like value added taxes.
The error in this method of evaluating taxes is that it does not consider the political economy determinants of the level of taxes.
From this political economy perspective, the value added tax does not look so attractive, at least to those of us who worry that governments would spend and tax at higher levels than is economically and socially desirable.
Reforms ensued after 1980 led by parties on the Left and Right, with some members of existing political groupings benefiting from joining new political coalitions.
The deadweight losses of taxes, transfers and regulation limit inefficient policies and the sustainability of redistribution.
Peltzman likes to note that at the start of the 20th century, the United States government was about 8% of GDP. The two largest programs were education and highways. The post office was as big as the military.
Government is about five times that now with defence, health, education and income security accounting for 70% of this total. Peltzman makes the very interesting point that:
There is no new program in the political horizon that seems capable of attaining anything like the size of any of these four.
For the time being the future government rest on the extent of existing mega programs.
Health and income security account for 55% of total government spending in the OECD. It is in these two programs where the future of the growth of government lie.
The pressure for that growth in government will come from the elderly. Governments will have to choose between high taxes on the young to fund these programs for the elderly or find other options.


Recent Comments