Competing visions of success – left and right
06 Feb 2015 Leave a comment
in applied welfare economics, entrepreneurship, human capital, labour economics, occupational choice, politics - New Zealand, politics - USA Tags: activists, distributive justice, do gooders, expressive voting, Leftover Left, poverty and inequality, rational ignorance, rational irrationality, top 1%
Why popularist politics work: People Are Terrible at Estimating Income Inequality
05 Feb 2015 Leave a comment
in economics of information, politics - Australia, politics - New Zealand, politics - USA, Public Choice Tags: expressive voting, poverty and inequality, rational ignorance, rational irrationality, the top 1%, urban myths


The Left and Right approaches to poverty
01 Feb 2015 Leave a comment
in applied price theory, applied welfare economics, comparative institutional analysis, liberalism, poverty and inequality, welfare reform Tags: capitalism and freedom, Leftover Left, poverty and inequality, The Great Enrichment
The middle class has been shrinking for half a century because…
31 Jan 2015 Leave a comment
in applied welfare economics, politics - Australia, politics - New Zealand, politics - USA Tags: middle class stagnation, poverty and inequality
The New York Times passed over as quickly as it could the fact that up until the year 2000 the middle class was shrinking because more of them are moving into the upper middle class and the rich.
New Zealand – Chartbook of Economic Inequality
20 Jan 2015 Leave a comment
in applied welfare economics, politics - New Zealand, poverty and inequality Tags: Gini coefficient, poverty and inequality, top 1%
| Has the dispersion of earnings been increasing in recent decades? | Yes, the top decile has risen from 143 per cent of median in 1986 to 186 per cent in 2012. |
| Has overall inequality increased in recent years? | No, the Gini coefficient has been relatively stable around 32 percent since 1996. However, it rose by 7 percentage points between 1988 and 1996. |
| Have there been periods when overall inequality fell for a sustained period? | Yes, from mid-1950s to mid-1970s. |
| Has poverty been falling or rising in recent decades? | Poverty has substantially increased from 1996 to 2004 before decreasing mildly till 2009. |
| Has there been a U-pattern for top income shares over time? | Yes, top gross income shares fell from mid-1950s to mid-1980s, then rose from mid-1980s to mid-1990s. |
| Has the distribution of wealth followed the same pattern as income? | Insufficient evidence. |
| Additional noteworthy features | U-shape over post-war period. Top income shares estimates for the years 1998, 1999 and 2000 are affected by changes in the income tax laws. Top shares series have a break in 1951 (change in tax units). |

You are welcome to share but please refer to A. B. Atkinson and S. Morelli (2014) – ‘The Chartbook of Economic Inequality’ at http://www.ChartbookOfEconomicInequality.com
This visualisation is licensed under a Creative Commons BY-NC-SA license Data visualisation by: Max Roser
Is welfare dependence optimal for whom – part 7: the role of tagging in welfare benefits system
16 Dec 2014 Leave a comment
in economics of love and marriage, labour economics, labour supply, welfare reform Tags: child poverty, labour supply, poverty and inequality, welfare reform
The unambiguously favourable labour supply effects of work requirements are often contrasted with the ambiguous results of changes in benefit abatement regimes.
The twist is work requirements need to be accompanied by a categorisation of the welfare population into those who can work and those who cannot work. The latter do need welfare support because they are unable to earn a wage in the labour market or have carer responsibilities such as for pre-schoolers.
There is already a large population on other welfare benefits with short and long-term barriers to work because of sickness or invalidity classifications.
The favourable labour supply effects of work requirements depend on an ability to adequately categorise the welfare population into different groups. The large differences between otherwise comparable countries in the number on sickness and disability benefits suggest that this classification and sorting process is knowledge intensive and error prone.

The original support for negative income taxes from Friedman (1962) and Stigler (1946) was born of the notion that welfare bureaucracies are unable to adequately screen, categorise and tag welfare claimants by their capacity to work and diligent job search in a dynamic world with dispersed knowledge and moral hazard.
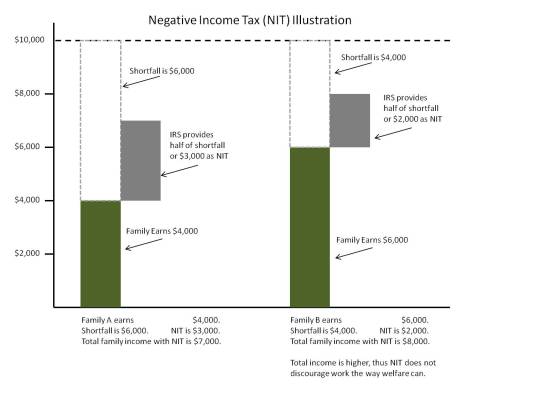
Negative income taxes were proposed as an administratively simple welfare reform to give adequate income support to the low paid, out of work and unable to work, while still providing reasonable work incentives for the low paid. The negative income tax was originally intended to replace existing welfare benefits for families at least.
The modern incarnations of negative income taxes manifest as in-work tax credits that supplement welfare benefits and reduce poverty among the working poor.

The ambiguous effect of negative income taxes on the net labour supply among the low-paid was acknowledged at the outset, and was borne out in experimental trials and experience with in-work tax credits.
The existing system of domestic purpose, unemployment, sickness and invalid benefits are all examples of screening, categorising and tagging of welfare claimants with varying degrees of success.
The tagging is based on relatively coarse screening devices such as job loss, sole parenthood and medical grounds.
Akerlof (1978) noted that the truly needy—those with low job skills who have extreme difficulty in becoming employed—can be partly identified by some measurable, observable characteristic, which he called tagging the poor. Some combination of indications of poor health, low levels of education and spotty employment histories might be indicators of low job skills.
If the government moves from a negative income tax, in which all those with income are paid benefits regardless of their characteristics, to a tagged system in which only the subset who have the particular set of characteristics indicating that they are needy are paid benefits, then higher benefits could be paid to the tagged individuals without changing total expenditure.
Depending on whether the welfare tag is job loss, sole parenthood, sickness or invalidity, different abatement regimes, benefit levels and work tests apply. ACC is another example of tagging with the screening based on accidental injury.
Most welfare systems tag Akerlof partly with family structure in mind as a characteristic, with benefits heavily concentrated on families with a single parent.
Family tax credits are based on tagging through the number of hours worked and the number of children that are dependent upon the wage earner.
Nichols and Zeckhauser (1982) argued that the imposition of “ordeals” on welfare recipients, of which work requirements were one example, but onerous application procedures and participation requirements are others, could serve to deter entry of the able-bodied.
The experience with tagging to date suggest that it’s not particularly accurate. social insurance systems for injury and illness have significant issues with moral hazard.
For example, before 15 July 1980, an employee injured in a workplace accident in Kentucky received compensations proportional to his or her wage with an upper limit of $131 per week.
On 15 July 1980, this limit was raised to $217 per week. The better paid wage-earners were substantially better compensated for accidents that occurred after that date.
The periods of convalescence of these better-paid workers grew 20 per cent longer. For accidents that occurred before 15 July, these employees had been off work for an average of 4.3 weeks; for accidents after 15 July caused the same employees to stay home for an average of 5.2 weeks.
The average convalescence period for injured workers who were less well paid was unaffected by the rise in the upper limit stayed the same before and after 15 July. It is absurd to suggest that workplace accidents had suddenly become more serious for these better-paid workers and only for them after 15 July 1980.
In the past three decades, the number of people who are on disability benefit has skyrocketed but incidence of disabling health conditions among the working age population is not rising. Autor (2006) found that disability rolls in the USA expanded because:
- congressional reforms to disability screening in 1984 that enabled workers with low mortality disorders such as back pain, arthritis and mental illness to more readily qualify for benefits;
- a rise in the after-tax income replacement rate, which strengthened the incentives for lower-skilled workers to seek benefits; and
- a rapid increase in female labour force participation that expanded the pool of insured workers.
Autor found that the aging of the baby boom generation has contributed little to the growth of disability benefit numbers to date.
David Autor and Mark Duggan (2003) found that low-skills and a poor education is predictor of disability: in the USA in 2004, nearly one in five male high school dropouts between ages 55 and 64 were in the disability program; that was more than double that of high school graduates of the same age and more than five times higher than the 3.7 % of college graduates of that age who collect disability. Unemployment is another driver of disability.
The only major success in reducing beneficiary numbers anywhere has been time limits in the USA in 1996. Time limits on welfare for single parents reduced caseloads by two thirds, 90% in some states.

The subsequent declines in welfare participation rates and gains in employment were largest among the single mothers previously thought to be most disadvantaged: young (ages 18-29), mothers with children aged under seven, high school drop-outs, and black and Hispanic mothers. These low-skilled single mothers were thought to face the greatest barriers to employment. Blank (2002) found that
nobody of any political persuasion predicted or would have believed possible the magnitude of change that occurred in the behaviour of low-income single-parent families.
Rebecca Blank is the field leader on the economics of welfare reform and got as high as Acting Secretary of the Department of Commerce for Obama.
Employment are never married mothers increased by 50% after the US reforms: employment a single mothers with less than a high school education increased by two thirds: employment of single mothers aged of 18 in 24 approximately doubled.

With the enactment of welfare reform in 1996, black child poverty fell by more than a quarter to 30% in 2001. Over a six-year period after welfare reform, 1.2 million black children were lifted out of poverty. In 2001, despite a recession, the poverty rate for black children was at the lowest point in national history.

This great success of US welfare reforms was that after decades of no progress, poverty among single mothers and among black children declined dramatically.
The best solution to poverty is to move people into a job. Simon Chapple is also quite clear in his mid-year book with Jonathan Boston that a sole parent in full-time work, and a two parent family with one earner with one full-time and one part-time worker, even at low wages, will earn enough to lift their children above most poverty thresholds. Welfare benefits trap children in poverty.
The best available analysis, the most credible analysis, the most independent analysis in New Zealand or anywhere else in the world that having a job and marrying the father of your child is the secret to the leaving poverty is recently by the Living Wage movement in New Zealand.
According to the calculations of the Living Wage movement, earning only $18.80 per hour with a second earner working only 20 hours affords their two children, including a teenager, Sky TV, pets, international travel, video games and 10 hours childcare.
This analysis of the Living Wage movement shows that finishing school so your job pays something reasonable and marrying the father of your child affords a comfortable family life.
Blogs so far:
part-one-the-labour-leisure-trade-off-and-the-rewards-for-working
part-two-the-labour-supply-effects-of-welfare-benefit-abatement-rate-changes
part-3-abatement-free-income-thresholds-and-labour-supply
part-4-in-work-tax-credits-and-labour-supply
part-5-higher-abatement-rates-and-labour-supply
@bryce_edwards New Zealand’s war on the poor – a fact check
15 Dec 2014 Leave a comment
in economic history, income redistribution, labour economics, Marxist economics, politics - USA, technological progress Tags: Bryce Edwards, Leftover Left, poverty and inequality
Bryce Edwards has shown in today’s column that he knows nothing about inequality in New Zealand, despite the statistics being at his fingertips:
Under capitalism there’s always going to be a war against the poor.
The process by which we divide up the resources of any society normally involves exploiting the majority for the benefit of the minority.
It’s called inequality. And this is how it is in New Zealand: those who have the most power look for ways to extract that money for themselves, or at least retain the status quo.
Against this are those who want to have a more equal society. It’s an age-old political issue, and one that has traditionally been at the heart of the left-right political divide.
In 2014 this concern about inequality has been a key feature of politics, underpinning much of what has occur…
Although the rich appear to have been winning for three decades in their ‘war against the poor’, perhaps the tide is turning?
There’s still every indication of severe poverty and inequality in this country.
Firstly, inequality has not increased in New Zealand for at least 20 years when either measured in figure 1 by the Gini coefficient or in figure 2, the top 1% income shares. Both the Gini coefficient and the top 1% income shares have not risen for 20 years.
Figure 1: Gini coefficient New Zealand 1980-2015

Source: Bryan Perry, Household incomes in New Zealand: Trends in indicators of inequality and hardship 1982 to 2013. Ministry of Social Development (July 2014).
Figure 2: Top 1% income shares, USA, New Zealand and Australia, 1970-2012
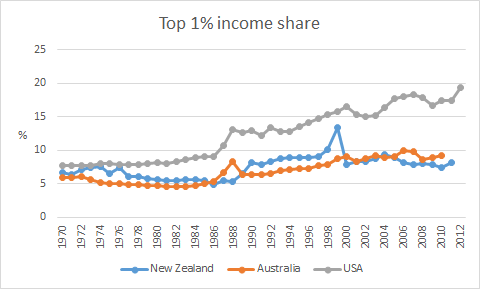
Source: top incomes database
Secondly, the benefits of the economic boom that lasted 15 years from the early 1990s until the onset of the global financial crisis would spread broadly across all sections of the New Zealand community. As shown in figure 3, both before and after housing costs increased. As shown in figure 4, real household incomes increased pretty much evenly across all of the 10 income deciles between 1994 and 2013.
Figure 3: Real household income trends before housing costs (BHC) and after housing costs (AHC), 1982 to 2013 ($2013)
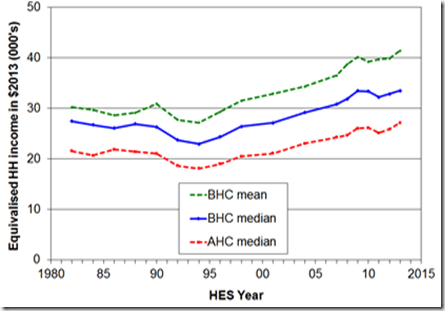
Source: Bryan Perry, Household incomes in New Zealand: Trends in indicators of inequality and hardship 1982 to 2013. Ministry of Social Development (July 2014).
Figure 4: Real household incomes (BHC), changes for top of income deciles, 1994 to 2013
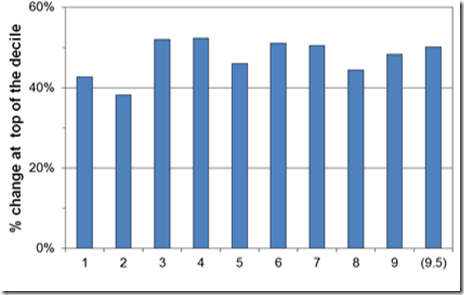
Source: Bryan Perry, Household incomes in New Zealand: Trends in indicators of inequality and hardship 1982 to 2013. Ministry of Social Development (July 2014).
Thirdly, as shown in figure 5, between 1994 and 2010, real equivalised median household income rose 47% from 1994 to 2010; for Māori, this rise was 68%; for Pasifika, the rise was 77%. Median household income increases of nearly 50% in 16 years should be celebrated.
Figure 5: Real equivalised median household income (before housing costs) by ethnicity, 1988 to 2013 ($2013).

Source: Bryan Perry, Household incomes in New Zealand: Trends in indicators of inequality and hardship 1982 to 2013. Ministry of Social Development (July 2014).
The massive improvements in Māori incomes since 1992 were based on rising Māori employment rates, fewer Māori on benefits, more Māori moving into higher paying jobs, and greater Māori educational attainment. Māori unemployment reached a 20-year low of 8 per cent from 2005 to 2008.
Over the last more than two decades in New Zealand, there has been sustained income growth spread across all of New Zealand society contrary to the warmed over Marxism of Bryce Edwards. Perry (2014) reviews the data every year for the Ministry of Social Development. He concluded that:
Overall, there is no evidence of any sustained rise or fall in inequality in the last two decades.
The level of household disposable income inequality in New Zealand is a little above the OECD median.
The share of total income received by the top 1% of individuals is at the low end of the OECD rankings.
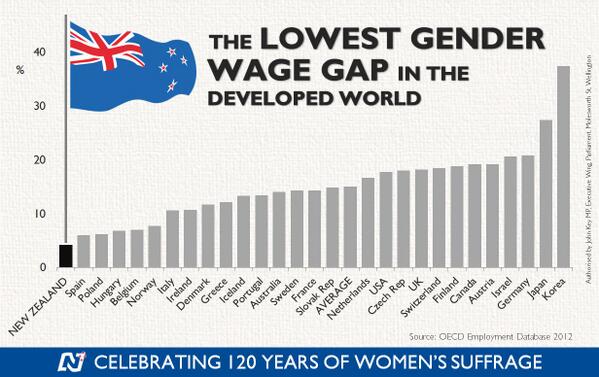
Bryce Edwards’ analysis was in the typical Marxist tradition – it had no gender analysis. He failed to mention that New Zealand has the smallest gender wage gap of all the industrialised countries.

As he did not notice these great successes in household incomes, incomes of every decile, Māori economic development and the empowerment of women, Bryce Edwards had nothing to add in terms of either consolidating or improving on them.
Greg Mankiw’s Blog: Spreading the Wealth Around
15 Dec 2014 Leave a comment
in applied welfare economics, liberalism Tags: poverty and inequality

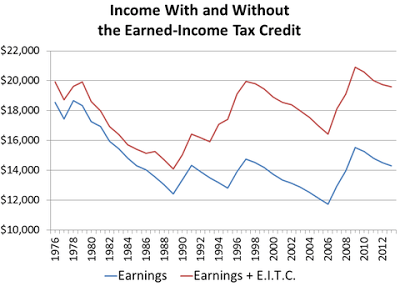
EITC is better than the Minimum Wage
15 Dec 2014 Leave a comment
in applied welfare economics, labour economics, liberalism, minimum wage, poverty and inequality Tags: earned income tax credit, family tax credits, in-work tax credits, minimum wage, negative income tax, poverty and inequality
How New Zealand’s rich-poor divide killed its egalitarian paradise | Max Rashbrooke | The Guardian – a boy’s own fact check
13 Dec 2014 Leave a comment
in discrimination, gender, labour economics, poverty and inequality Tags: gender wage gap, Gini coefficient, poverty and inequality, top 1%
What is claimed to have gone wrong by the op-ed in The Guardian overnight?
A stark rich-poor divide, the OECD argued, had taken over a third off the country’s economic growth rate in the last 20 years. But how could this be?
The simple answer is that in the two decades from 1985 onwards, New Zealand had the biggest increase in income gaps of any developed country.
Incomes for the richest Kiwis doubled, while those of the poorest stagnated. Middle income earners didn’t do too well, either.
Are these claims true? That is, in the two decades from 1985 onwards, have the incomes of the richest Kiwis doubled, while those of the poorest stagnated and have a middle income earners not done too well either?
Figure 1 shows that prior to the recent recession starting in 2009, there were 15 years of steady growth in median household incomes. As will be shown, most of the period covered both by the op-ed in the Guardian, and by the OECD paper was an economic boom.
Figure 1: Real household income trends before housing costs (BHC) and after housing costs (AHC), 1982 to 2013 ($2013)

Source: Bryan Perry, Household incomes in New Zealand: Trends in indicators of inequality and hardship 1982 to 2013. Ministry of Social Development (July 2014).
Perry (2104) found that net income gains from the mid-1990s to 2013 were similar for all income groups, so income inequality in 2013 was also similar to the mid-1990s – see Figure 2.
Figure 2: Real household incomes (BHC), changes for top of income deciles, 1994 to 2013
![clip_image002[7]](https://utopiayouarestandinginit.com/wp-content/uploads/2014/12/clip_image0027.png "clip_image002[7]")
Source: (Perry 2014).
Importantly, in the OECD analysis, much was made of what was happening to the 40% income decile. As can be seen from figure 2, this decile gained as much as any other group in New Zealand from the income growth between 1994 and 2013.
The Gini coefficient in figure 3 , which years the most common measure of inequality, shows no evidence of a rise in income inequality since the mid-1990s. The trend-line of the genie coefficient in figure 3 is almost flat since the early 1990s .
Figure 3: Gini coefficient New Zealand 1980-2015

Source: (Perry 2014).
To make things more awkward, the large increase in income inequality in New Zealand in the late 1980s and early 1990s shown in figure 3 was followed by a 15 year economic boom after 20 years of economic stagnation – next to no income growth – as is shown in figure 4.
Figure 4: Real GDP per New Zealander and Australian aged 15-64, converted to 2013 price level with updated 2005 EKS purchasing power parities, 1956-2013

Source: Computed from OECD Stat Extract and The Conference Board, Total Database, January 2014, http://www.conference-board.org/economics
The lost decades of the growth in the 1970s and 1980s were replaced with a long boom. Trend growth of 2% per year returned after this increase in inequality – see figure 4.
The gains since the economic boom since the early 1990s has been broadly based both up and down the income distribution and by ethnicity. As shown in figure 5, between 1994 and 2010, real equivalised median household income rose 47% from 1994 to 2010; for Māori, this rise was 68%; for Pasifika, the rise was 77%.
Figure 5: Real equivalised median household income (before housing costs) by ethnicity, 1988 to 2013 ($2013).
![clip_image002[9]](https://utopiayouarestandinginit.com/wp-content/uploads/2014/12/clip_image00292.png "clip_image002[9]")
Source: (Perry 2014).
These improvements in Māori incomes since 1992 were based on rising Māori employment rates, fewer Māori on benefits, more Māori moving into higher paying jobs, and greater Māori educational attainment should be celebrated and consolidated. Māori unemployment reached a 20-year low of 8 per cent from 2005 to 2008.
As for the top 1%, as shown by Figure 6, their income share has been steady at 8-9% since the mid-1990s. It was only in the USA the top 1% share continued to rise strongly, from 13% to 19%.
Figure 6: income shares of the top 1% of earners, New Zealand, Australia and USA

source: Top incomes database
Over the last more than two decades in New Zealand, there has been sustained income growth spread across all of society. Perry (2014) concluded that:
Overall, there is no evidence of any sustained rise or fall in inequality in the last two decades.
The level of household disposable income inequality in New Zealand is a little above the OECD median.
The share of total income received by the top 1% of individuals is at the low end of the OECD rankings.
What is claimed as the causes of this growing rich-poor divide that is also slowing growth by a third?
Tracing the causes of a growing income gap is like trying to map earthquake fault lines – never a precise science – but it is hard to ignore the correlation between the timing of the increase and the country’s post-1984 political revolution.
Embracing reforms known elsewhere as Thatchernomics and Reaganomics with unprecedented enthusiasm, New Zealand halved its top tax rate, cut benefits by up to a quarter of their value, and dramatically reduced the bargaining power – and therefore the share of national income – of ordinary workers.
Thousands of people lost their jobs as manufacturing work went overseas, and there was no significant response with increased trade training or skills programmes, a policy failure that is on-going.
At the same time, New Zealand stopped building affordable houses in any serious quantity, forcing poorer households to spend ever-increasing amounts on rent and mortgages.
As will be recalled from Figure 4, the economic reforms in New Zealand were followed by a long economic boom starting in 1992 that only came to an end with the onset of the global financial crisis.
Figure 7 shows that from 1994, the proportion of the lowest income households spending more than 30% of their income on housing fell steadily, reaching 34% by 204.
Figure 7: Proportion of households spending more than 30% of their income on housing costs by income quintile, New Zealand 1988–2013 HES years

Source: Perry (2014)
Housing affordability was improving for much of the period in which the op-ed in the Guardian was claiming it was getting worse. The increase in housing unaffordability in the late 1980s and early 1990s coincided with a deep recession and a cut in welfare benefits.
Housing affordability has become an issue in New Zealand because of rising prices. Supply is not keeping up with demand.
There were considerable increases in prices throughout the house price distribution between 2004 and 2008. Median house price increasing by over 50% between 2004 and 2008; the price rises were largest among the lower price houses.
It was not a case of a decline in demand under the hypothesis that is put forward in the op-ed in the Guardian. For that hypothesis to hold, housing prices would somehow have to fall in the price range of ordinary workers. That is not the case.
Furthermore, the large increase in housing prices and decline in housing affordability occurred a decade and more after the increase in inequality in the late 1980s and early 1990s. The timing is out.
Another inconvenience for the rich poor divide hypothesis is during the housing price boom after 2004 rent to disposable income for all income quintiles remained relatively constant. Rents were stable.
Poorer households are more likely to rent, and therefore much less likely to be affected by the housing affordability crisis in New Zealand as that was mostly about home ownership.
Gender analysis! Gender analysis? Where is the gender analysis? Over the last 20 to 30 years, the gender gap has closed substantially in terms of wages and employment. Young women now outnumber young men two to one at university.

New Zealand has the smallest gender wage gap in the Western world. That is inconsistent with the notion in New Zealand has a rich poor divide. Instead New Zealand appears to be an egalitarian paradise as long as you are not a boy!
The major driver of inequality in New Zealand and overseas is the rising number of two-income households made up of two well-educated parents and one or two children and many more single parent households on low pay or no one in paid employment in the house. Well-educated couples form into high income households; fewer of the less educated marry and too many end up a single mothers.

Source: closertogether.org.nz
The main cause of poverty in New Zealand is dependency on welfare benefits and in particular the number of single parents. Child poverty in beneficiary families is 75% to 80%, much higher than in families with at least one adult in full-time employment (11% in 2012 and 2013). The payment of welfare benefits to families who do not work guarantees an income to people not in a job, but it creates incentives not to work.

The economic and sociological literatures overseas increasingly suggesting that skill disparities resulting from a lower quality education and less access to good parenting, peer and neighbourhood environments produce most of the income gaps of racial and ethnic minorities rather than factors such as labour market discrimination.
Policy bubbles alert: can more money reduce child poverty?
12 Dec 2014 Leave a comment
in labour economics, welfare reform Tags: capitalism and prosperity, poverty and inequality, Susan Mayer, The Great, the withering away of the proletariat, welfare reform
 Susan Mayer in her book What Money Can’t Buy found very little evidence to support the widely held belief that parental income has a significant effect on children’s life outcomes. Mayer:
- Challenged the assumption that poverty directly causes poor health, behavioural problems, and a host of other problems for children;
- Also stated that there was no correlation but a coincidence with a missing third factor, which was jobs; and
- Found that household conditions are highly responsive to income but how it is spent is what matters more.
These findings were Susan Mayer are of profound importance because far too many people believe the solution to child poverty is to give the poor more money. What could be simpler.
Capitalism have been giving the poor more money for centuries now. This great enrichment dwarfs anything that redistribution and egalitarian politics and the welfare state has done in the 20th century.
Mayer said that her findings do not endorse massive cuts in welfare:
My results do not show that we can cut income support programs with impunity…
Indeed, they suggest that income support programs have been relatively successful in maintaining the material living standard of many poor children.
Mayer found that non-monetary factors play a bigger role than previously thought in determining how children overcome disadvantage as she explains.
Parent-child interactions appear to be important for children’s success, but the study shows little evidence that a parent’s income has a large influence on parenting practices.
Mayer said that if money alone were responsible for overcoming such problems as unwed pregnancy, low educational achievement and male idleness, states with higher welfare benefits could expect to see reductions in these problems. In reality,
once we control all relevant state characteristics, the apparent effect of increasing Aid to Families with Dependent Children benefits is very small
Mayer is of the view that many of the activities that improve children’s outcomes are more related to parenting choices than to income:
They mainly reflect parents’ tastes and values.
Books appear to benefit children because parents who buy a lot of books are likely to read to their children.
Parents who do not buy books for their children are probably not likely to read to them even if the books are free, and parents who do not take their children on outings may be less likely to spend time with them in other ways.
Among her findings, which have largely survive the test of time, are:
- Higher parental income has little impact on reading and mathematics test scores.
- Higher income increases the number of years children attend school by only one-fifth of a year.
- Higher income does not reduce the amount of time sons are idle as young adults.
- Higher income reduces the probability of daughters growing up to be single mothers by 8 to 20 percent.
Mayer found that as parents have more money to spend, they usually spend the extra money on food, especially food eaten in restaurants; larger homes; and on more automobiles.
As a result, children are likely to be better housed and better fed, but not necessarily better educated or better prepared for high-income jobs. This is her key conclusion about what money can and cannot buy:
If we are asking specifically about the relationship between parental income and children’s outcomes, a fairly clear answer is emerging: parental income itself has a modest effect on children’s outcomes and this effect is not necessarily greater for children from poor families compared to children from rich families.
Mayer’s analysis in many ways reflects her own life story. She divorced in the mid-1970s and had so many money troubles that she had trouble paying the rent.
She remarried in the early 1980s and had a second child. This second child at a comfortable middle-class upbringing. The mother went on to complete a Ph.D. and ended up as head of the Harris School of Public Policy at the University of Chicago.
Mayer noticed that both of her children turned out pretty much the same despite the older child was raised in poor circumstances. The common factor to this success was they had the same mother.
Charles Murray and the OECD’s Trends in Income Inequality and its Impact on Economic Growth – IQ, signalling, over-education and plain bad career advice
11 Dec 2014 Leave a comment
in economics of education, human capital, international economics, labour supply, occupational choice, poverty and inequality Tags: Bryan Caplan, Charles Murray, IQ and education, poverty and inequality, signalling
Charles Murray has been cooking with gas lately – on fire. One of his points is too many go to college. Murray points out that succeeded at college requires an IQ of at least 115 but 84% of the population don’t have this:
Historically, an IQ of 115 or higher was deemed to make someone “prime college material.”
That range comprises about 16 per cent of the population.
Since 28 per cent of all adults have BAs, the IQ required to get a degree these days is obviously a lot lower than 115.
Those on the margins of this IQ are getting poor advice to go to college. Murray argues that other occupational and educational choices would serve them better in light of their abilities and likelihood of succeeding at college. Moreover, Murray is keen on replacing college degrees with certification after shorter periods of study such as in the certified public accountants exam.
Murray believes a lot of students make poor investments by going on to College, in part, because many of them don’t complete their degrees:
…even though college has been dumbed down, it is still too intellectually demanding for a large majority of students, in an age when about 50 per cent of all high school graduates are heading to four-year colleges the next fall.
The result is lots of failure. Of those who entered a four-year college in 1995, only 58 per cent had gotten their BA five academic years later.
Murray does not want to abandon these teenagers:
Recognizing the fact that most young people do not have ability and/or the interest to succeed on the conventional academic track does not mean spending less effort on the education of some children than of others.
…Too few counsellors tell work-bound high-school students how much money crane operators or master stonemasons make (a lot).
Too few tell them about the well-paying technical specialties that are being produced by a changing job market.
Too few assess the non-academic abilities of work-bound students and direct them toward occupations in which they can reasonably expect to succeed.
Worst of all: As these students approach the age at which they can legally drop out of school, they are urged to take more courses in mathematics, literature, history and science so that they can pursue the college fantasy. Is it any wonder that so many of them drop out?
To add to that, he is in the Bryan Caplan School: education is often an elaborate former of signalling for many degrees. Murray says that college is a waste of time because:
Outside a handful of majors — engineering and some of the sciences — a bachelor’s degree tells an employer nothing except that the applicant has a certain amount of intellectual ability and perseverance.
Even a degree in a vocational major like business administration can mean anything from a solid base of knowledge to four years of barely remembered gut courses.
If the OECD is to be believed, that not enough people are going to college from lower middle class families, obviously IQ is not one of the constraints on access to college Charles Murray suggested it to be.

The growing strength of the case that education is a form of signalling is a literature that the now famous OECD paper reviewed, found wanting, but did not have time to discuss in the working paper.

Another contemporary theme the OECD paper reviewed, found wanting, but did not have time to discuss is a large number of graduates who end up holding jobs that do not require a university education – going to college:
About 48 per cent of employed U.S. college graduates are in jobs that the Bureau of Labor Statistics (BLS) suggests requires less than a four-year college education.
Eleven per cent of employed college graduates are in occupations requiring more than a high-school diploma but less than a bachelor’s, and 37 per cent are in occupations requiring no more than a high-school diploma.
The proportion of overeducated workers in occupations appears to have grown substantially; in 1970, fewer than one per cent of taxi drivers and two per cent of fire-fighters had college degrees, while now more than 15 per cent do in both jobs
All in all, the OECD has gone into the dragons den by backing the accumulation of human capital as its mechanism to link inequality with lower growth. No matter how you spin it, this linking of lower economic growth to greater inequality through financial constraints on the accumulation of human capital by the lower middle class was a bold hypothesis.

The case for investing more in education is not a slam dunk. Higher education – university or polytechnic – is a rat race that many don’t need to join.The case for the government paying a great many more to join that rat race is rather weak.
Trends in Income Inequality and its Impact on Economic Growth – OECD – is it all about not enough graduates – updated?
11 Dec 2014 Leave a comment
in economics of education, human capital, labour economics, occupational choice, poverty and inequality Tags: educational attainment, human capital, poverty and inequality, student loans, tuition fees
The analysis of the OECD published overnight depends crucially upon how greater inequality reduces the ability of the lower income families to invest in human capital.
The OECD theory of inequality and lower growth is there is a financing constraint because of inequality that reduces economic growth because of less human capital accumulation by lower income families.
Proportion of adults aged 25–64 years with an educational qualification of at least upper secondary level and tertiary level, 1991–2009

In a nutshell, not enough people are going to university. Apparently, the explosion in tertiary educational attendance over the last generation, an increase of about 150% for the adult population aged 25 to 64, was just not good enough.
But what about adults aged 25 to 34, recent graduates, how many of them are there?

There was an explosion of young New Zealanders in the late 1990s who qualified for a degree from a university or diploma from a Polytech.
Under the hypothesis of the OECD about financial constraints retarding the accumulation of human capital among the lower middle class – the fourth decile of the income distribution – even more young New Zealanders should have gone to university or Polytech.
Are there many New Zealanders left who are qualified and suited to tertiary education who do not go?
That is the crux of the OECD position: not enough lower-middle-class New Zealanders go on to obtain higher education and upgrade their skills because of financial constraints in a country was in interest free student loans, means tested student allowances, and the government subsidises for 75% of all tuition fees. Tuition fees only equal 25% of the actual cost and any one can get a student loan to cover this fee.

Recent Comments