Figure 1: Real GDP per New Zealander and Australian aged 15-64, converted to 2013 price level with updated 2005 EKS purchasing power parities, 1956-2013, $US
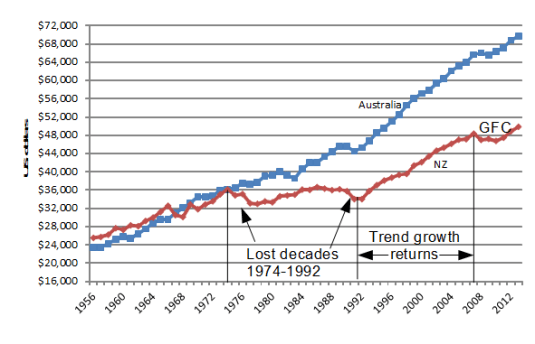
Source: Computed from OECD Stat Extract and The Conference Board, Total Database, January 2014, http://www.conference-board.org/economics
Figure 1 shows that New Zealand lost two decades of growth between 1974 and 1992 after level pegging with Australia for the preceding two decades.
New Zealand returned to trend growth between 1992 and 2007. New Zealand did not make up the lost growth of the previous two decades to catch up to Australia.
Figure 2: Real GDP per New Zealander and Australian aged 15-64, converted to 2013 price level with updated 2005 EKS purchasing power parities, 1.9 per cent detrended, base 100 = 1974, 1956-2013, $US
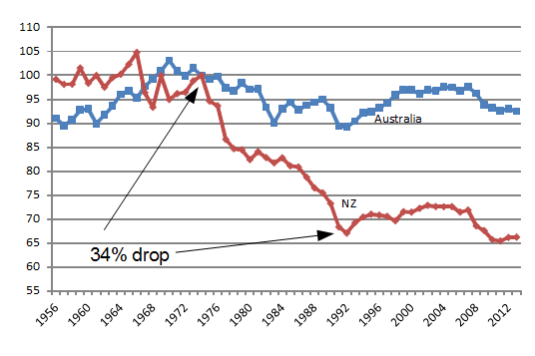
Source: Computed from OECD Stat Extract and The Conference Board, Total Database, January 2014, http://www.conference-board.org/economics
In Figure 2, a flat line equates to a 1.9% GDP annual growth rate; a falling line is a below trend growth rate; a rising line is an above 1.9% growth rate.
Figure 2 shows that there was a 34% drop against trend between 1974 and 1992; a return to trend growth and slightly better between 1992 and 2007; and then a recession to 2010.
Australia had its ups and downs since 1956 but essentially grew at the trend growth rate of 1.85% since 1970. The so-called resources boom in Australia does not show up in Figures 1 or 2.
There was no growth rebound in New Zealand to recover the lost ground, either in the lost decades between 1974 and 1992, or after the Global Financial Crisis. The strong GDP growth in Australia after that Keating recession in 1991 is an example of the country recovering lost ground after a recession – See Figure 2.
A trend growth rate of 1.9% is the 20th century trend growth rate that Edward Prescott currently estimates for the global industrial leader, which is the United States of America.

Nov 19, 2014 @ 08:32:22
Interesting, definitely in my Around the Traps
LikeLike