In Switzerland between 1973 and 1996 and in New Zealand from 1974 to 1992, both countries met Edward Prescott’s definition of an economy in a great depression. Prescott’s definition of a depression is when the economy is significantly below trend, the economy is in a depression. A great depression is a depression that is deep, rapid and enduring:
- There is at least one year in which output per working age person is at least 20 percent below trend; and
-
there is at least one year in the first decade of the great depression in which output per working age person is at least 15 percent below trend; and
-
There is no significant recovery during the period in the sense that there is no subperiod of a decade or longer in which the growth of output per working age person returns to rates of 2 percent or better.
I am updating the real GDP and detrended growth data in the study of Tim Kehoe of the New Zealand and Swiss great depressions to as recently as possible, which is to 2013 for New Zealand and2012 for Switzerland.
Figure 1: Real GDP per New Zealander, Swiss and Australian aged 15-64, converted to 2013 price level with updated 2005 EKS purchasing power parities, 1.9 per cent detrended, 1956-2013
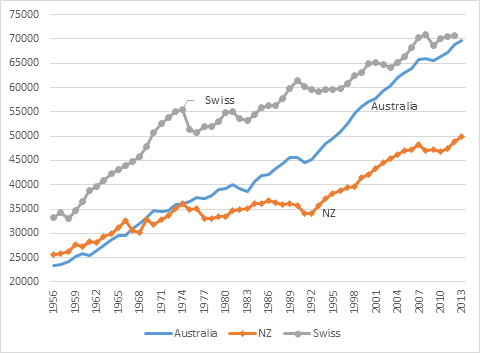
Source: Computed from OECD Stat Extract and The Conference Board, Total Database, January 2014, http://www.conference-board.org/economics
I included Australia in figure 1 both to show that Australians caught up with the Swiss in real GDP per working age person and to show an economy that grew at its trend growth rate of 1.9% for the entire post-war period – see figure 2. Australia neither caught up to nor fell behind the USA. That’s what growing at 1.9% per year means. A country is growing at the same rate as the USA grew for the 20th century. The USA for the purposes of this analysis is defined as the global economic frontier – the country with the most advanced technology.
Figure 2: Real GDP per New Zealander and Australian aged 15-64, converted to 2013 price level with updated 2005 EKS purchasing power parities, 1.9 per cent detrended, 1956-2013
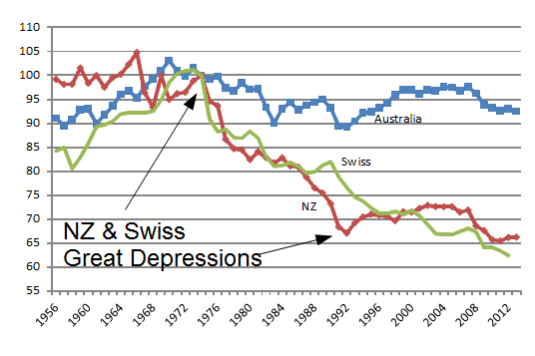
Source: Computed from OECD Stat Extract and The Conference Board, Total Database, January 2014, http://www.conference-board.org/economics
Figure 2 shows the detrended rates of real GDP growth for New Zealand, Australia and Switzerland. A flat line in figure 2 is a country growing at its trend rate of 1.9%. A falling line indicates below trend rate of growth; a rising line indicates growth that year that is above the trend rate of growth of 1.9%.
Between 1973 and 2000, real GDP per working-age New Zealander and Swiss fell a cumulative 30 percent below the trend growth path. If New Zealand and Switzerland had grown at their trend rates, they would have been 30% richer than now. In common with Australia, New Zealand would be catching up to Switzerland in real GDP per working age person but for the two decades of lost growth between 1973 and 1992.
Since 1992, New Zealand had trend growth rate of 1.9% until the onset of the global financial crisis. The Swiss grew at its trend rate of 1.9% for a few years between 1996 and 2000 and 2003 and 2008 with recessions in between.
New Zealand and Switzerland have had the worst growth performance of any OECD member country since the 1970s. The Swiss have been in continual economic decline more or less since 1973.
New Zealand returned to trend growth in 1992, but there was no catch up period of rapid growth that recovered some of the previous lost growth, which is a common outcome after a recession or depression. That is, after the recession or depression, there is a period of rapid growth recovering some of the lost ground. That didn’t happen in New Zealand. A rule with depressions and recessions is the deeper the recession or depression, the faster the recovery (Alchian 1969, Friedman 1996).

Recent Comments