 The first graph appeared in the IPCC 1990 First Assessment Report (FAR) credited to H.H.Lamb, first director of CRU-UEA. The second graph was featured in 2001 IPCC Third Assessment Report (TAR) the famous hockey stick credited to M. Mann.
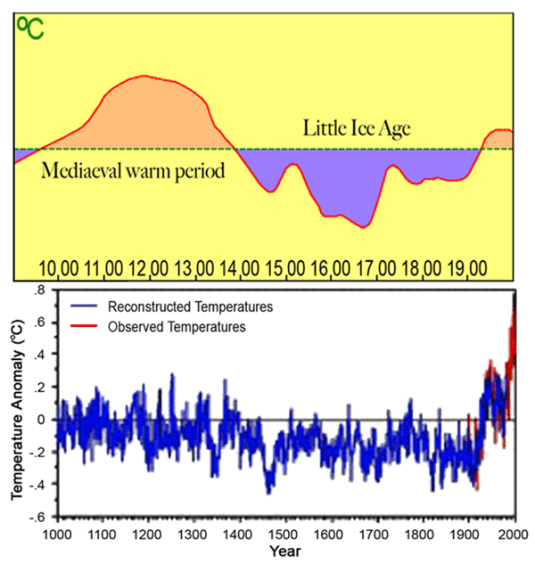
A previous post Rise and Fall of CAGW described the process that began with Hansen’s flashy Senate testimony in 1988, later supported by Santer’s flashy paper in 1996. This post traces a second iteration that ensued following Michael Mann’s production of the infamous Climate Hockey Stick graph in 1998. The image at the top comes from the 2001 IPCC TAR (Third Assessment Report) signifying the immediate embrace of this alarmist tool by consensus climatists. The message of the graph was to assert a spike in modern warming unprecedented in the last 1000 years. This claim of a “Modern Warming Spike” required a flat temperature profile throughout the Middle Ages (since 1000…
View original post 3,437 more words

Recent Comments