Based on Leonard Read’s famous essay “I, Pencil,” this short video beautifully illustrates the vast complexity that we carry in our pockets.
No one person could ever make a smartphone. It required the spontaneous cooperation of millions across all countries. The world could never be reinvented by a single mind, but rather requires the coordination of plans made possible only through private property and the price system.
the implied cost of housing restrictions across the whole U.S., and Chang and Enrico find that aggregate output is lower by about 10-14% because of them.
Last post on the NBER growth session. Chang-Tai Hsieh (Chicago) and Enrico Moretti (Berkeley) presented a paper on wage dispersion across cities in the U.S. Wage dispersion (New Yorkers earn more than people in Cleveland) either represents compensation for living costs (housing in New York is more expensive than in Cleveland), a real difference in productivity (New Yorkers are more productive than Clevelanders), or some combination of the two.
What Chang and Enrico find is that the increase in wage dispersion across cities in the U.S. over the last thirty-ish years is due almost entirely to rising house prices in six cities: NY, DC, Boston, San Fran, San Jose, and Seattle. Wages have gone up rapidly in those cities, but that is basically just compensating their citizens for the higher costs of living.
Now, given the costs of living, the allocation of population across cities in the U.S. is…
I just came across this great blog by Alex White on the three types of voters: utilitarian/instrumental, swinging and expressive. His diagrammatic expressions of them are superb. Most enlightening.
His first diagram above shows three consumer types of engagement with a brand: utilitarian, low involvement and expressive.
Utilitarian decision making is one that is typically high involvement, but are partly price sensitive;
Low involvement buyers do not spend a lot of time researching the features of the product or service, beyond a cursory glance; and
Expressive consumers are ones who make in depth purchases where there is a high engagement. Their decision to purchase precedes research. The research itself serves to rationalise the purchase decision. Often, they will feel a relationship with the brand and identify with the brand’s values.
White then overlaps these brand engagement profiles on voter profiles in the next diagram made up of utilitarian/instrumental, swinging and expressive and then fleshes out these voter types depending on whether they are rusted or swinging.
The rusted-on utilitarian voter votes on a specific issue and are loyal to the party that represents the best fit with that issue. For example, the Greens and forestry, or Labor and education. So long as they view the party as best fitting or addressing their issue, they’ll vote for that party.
A swinging utilitarian voter listens to announcements during campaigns, and tries to make a decision based on what is best for them. These swinging voters are susceptible to the pork barrel promises. Utilitarian voters are sensitive to their expectations being met.
The swinging low engagement voter has no party familiarity, no interest in politics, and do not do any assessment of party policies; they make up their mind based on availability of the party on Election Day (so the presence of people handing out how-to-votes is important). They see no difference between parties; they are completely switchable, so there is no brand loyalty. A low involvement voter is really looking at the absence of negatives.
The rusted on expressive voter votes to convey their values or beliefs, and often strongly identify with the party, or with a party leader. They are partisans who seek out research or information to justify their support for that party. The have a strong emotional connection to the party, or they may be ideologues and identify with a political philosophy rather than the party.
The swinging expressive voter is an ideologue whose voting decision is based on their political ideology. For example, strong environmentalists who support the Greens Party because of their commitment to conservation rather than to the Party itself. The swinging expressive voter may change their vote if they feel a party ceases to represent their value set or beliefs. The expressive voter expectations align with their values or ideology. Their relationship to the party can be very committed, but also very critical. They may tolerate or forgive lapses on policy areas outside the voter’s core values — and they can be passionate advocates.
Alex White has set out a great topology of voters, and how a political party or lobby group should appeal to different types of voters based on their engagement and information needs. White is secretary of UnionsACT, the peak body for 33 unionists Unions in Canberra.
Higher incomes that allow people to make livings that afford them more than merely survival or avoiding starvation.
A low poverty rate.
High quality and diversity of employment opportunities. Rather than the choice of being a farmer or being a blacksmith, the average citizen should have an array of careers to choose from, and the ability to be industrious and take risks for profit.
The availability of housing. On an average night in the United States, a country with a population of somewhere around 350 million, fewer than one million people are homeless.
Consistent GDP growth.
Access to quality health care.
The availability of quality education. (I suppose we could quibble over the word “quality,” but certainly there is widespread free education availability.)
High life expectancy. Worldwide life expectancy has more than doubled from 1750 to 2007.
Low frequency of deadly disease.
Affordable goods and services.
Infrastructure that bolsters economic growth.
Political stability.
Air conditioning.
Freedom from slavery, torture and discrimination.
Freedom of movement, religion and thought.
The presumption of innocence under the law.
Equality under the law regardless of gender or race.
The right to have a family – as large as one can support. Maybe even larger.
The right to enjoy the fruits of labor without government – or anyone else – stealing it.
The top one per cent comprises anyone with an income over $34,000 after tax, meaning a family of four must earn $136,000 to make it in the category, according to CNN.
One quarter of the group’s members live in Europe, with 4million in Germany and 3million in each of the UK, France and Italy. Other countries with large numbers of ‘the 1%’ include Canada, Japan and Brazil.
I didn’t know that we were in the top 1%. They are yet to update the mailing list of the ruling class to include us in any of the Wellington-based meetings to decide the direction of capitalism and the next steps in the immiseration of the proletariat.
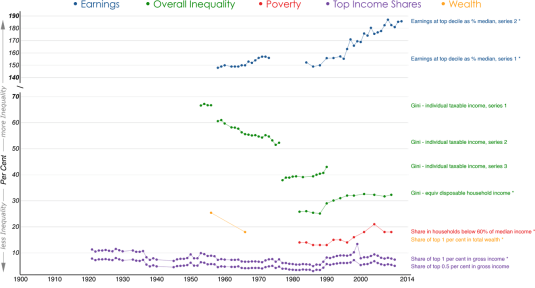
Has the dispersion of earnings been increasing in recent decades?
Yes, the top decile has risen from 143 per cent of median in 1986 to 186 per cent in 2012.
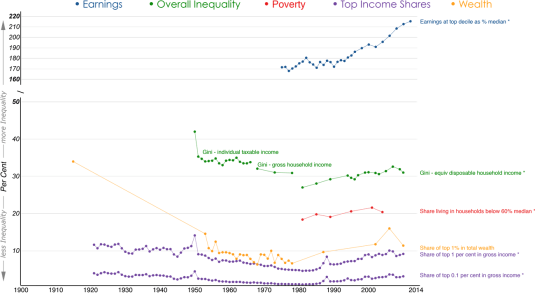
Yes, top decile of earnings has increased from 175 per cent of median in 1975 to 215 per cent in 2012.
Has overall inequality increased in recent years?
No, the Gini coefficient has been relatively stable around 32 percent since 1996. However, it rose by 7 percentage points between 1988 and 1996.
Yes, Gini coefficient has increased by 5 percentage points since 1981.
Have there been periods when overall inequality fell for a sustained period?
Yes, from mid-1950s to mid-1970s.
Yes, overall inequality and top shares fell from early 1950s to end of the 1970s.
Has poverty been falling or rising in recent decades?
Poverty has substantially increased from 1996 to 2004 before decreasing mildly till 2009.
Risen since 1981.
Has there been a U-pattern for top income shares over time?
Yes, top gross income shares fell from mid-1950s to mid-1980s, then rose from mid-1980s to mid-1990s.
Yes, top gross income shares fell from 1921 to around 1980 and then began to rise, reaching pre-war levels before the 2007 crisis.
Has the distribution of wealth followed the same pattern as income?
Insufficient evidence.
Yes, the share in total wealth of the wealthiest 1% of the population dropped more than threefold from 1915 to the end of 1970s before rising again till the onset of 2007 crisis. However, the rise was not sufficient to return to pre-war levels of concentration.
Additional noteworthy features
U-shape over post-war period. Top income shares estimates for the years 1998, 1999 and 2000 are affected by changes in the income tax laws. Top shares series have a break in 1951 (change in tax units).
Rising inequality on all (observable) dimensions for past thirty years.
Australia has become more unequal over the past 30 years as compared to New Zealand, but it is also become 30% richer than New Zealand.
Looks like John Rawls was right for the average Australian as compared to the average New Zealander. Australia is a more unequal society but a far richer society because of it, which is a fair deal if Rawls is to be believing.
Why Evolution is True is a blog written by Jerry Coyne, centered on evolution and biology but also dealing with diverse topics like politics, culture, and cats.
In Hume’s spirit, I will attempt to serve as an ambassador from my world of economics, and help in “finding topics of conversation fit for the entertainment of rational creatures.”
“We do not believe any group of men adequate enough or wise enough to operate without scrutiny or without criticism. We know that the only way to avoid error is to detect it, that the only way to detect it is to be free to inquire. We know that in secrecy error undetected will flourish and subvert”. - J Robert Oppenheimer.


Recent Comments