Figure 1: No relation between a country’s innovativeness and R&D tax credits

Figure 2. Proliferation of R&D tax credits in Europe

via R&D tax incentives: New evidence on trends and effectiveness | VOX, CEPR’s Policy Portal.
Celebrating humanity's flourishing through the spread of capitalism and the rule of law
21 Jan 2015 Leave a comment
in applied price theory, applied welfare economics, comparative institutional analysis, entrepreneurship, survivor principle Tags: corporate welfare, Euroland, Eurosclerosis, R&D, R&D tax credits
Figure 1: No relation between a country’s innovativeness and R&D tax credits
Figure 2. Proliferation of R&D tax credits in Europe
via R&D tax incentives: New evidence on trends and effectiveness | VOX, CEPR’s Policy Portal.
20 Jan 2015 Leave a comment
in applied welfare economics, politics - Australia, politics - New Zealand Tags: Leftover Left, poverty and inequlaity, top 1%
| New Zealand | Australia | |
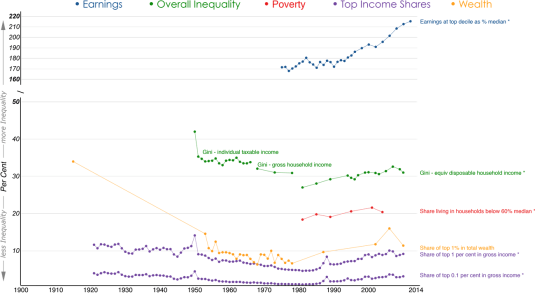
| Has the dispersion of earnings been increasing in recent decades? | Yes, the top decile has risen from 143 per cent of median in 1986 to 186 per cent in 2012. | Yes, top decile of earnings has increased from 175 per cent of median in 1975 to 215 per cent in 2012. |
| Has overall inequality increased in recent years? | No, the Gini coefficient has been relatively stable around 32 percent since 1996. However, it rose by 7 percentage points between 1988 and 1996. | Yes, Gini coefficient has increased by 5 percentage points since 1981. |
| Have there been periods when overall inequality fell for a sustained period? | Yes, from mid-1950s to mid-1970s. | Yes, overall inequality and top shares fell from early 1950s to end of the 1970s. |
| Has poverty been falling or rising in recent decades? | Poverty has substantially increased from 1996 to 2004 before decreasing mildly till 2009. | Risen since 1981. |
| Has there been a U-pattern for top income shares over time? | Yes, top gross income shares fell from mid-1950s to mid-1980s, then rose from mid-1980s to mid-1990s. | Yes, top gross income shares fell from 1921 to around 1980 and then began to rise, reaching pre-war levels before the 2007 crisis. |
| Has the distribution of wealth followed the same pattern as income? | Insufficient evidence. | Yes, the share in total wealth of the wealthiest 1% of the population dropped more than threefold from 1915 to the end of 1970s before rising again till the onset of 2007 crisis. However, the rise was not sufficient to return to pre-war levels of concentration. |
| Additional noteworthy features | U-shape over post-war period. Top income shares estimates for the years 1998, 1999 and 2000 are affected by changes in the income tax laws. Top shares series have a break in 1951 (change in tax units). | Rising inequality on all (observable) dimensions for past thirty years. |
Australia has become more unequal over the past 30 years as compared to New Zealand, but it is also become 30% richer than New Zealand.
Looks like John Rawls was right for the average Australian as compared to the average New Zealander. Australia is a more unequal society but a far richer society because of it, which is a fair deal if Rawls is to be believing.
Figure 1: New Zealand inequality chart book
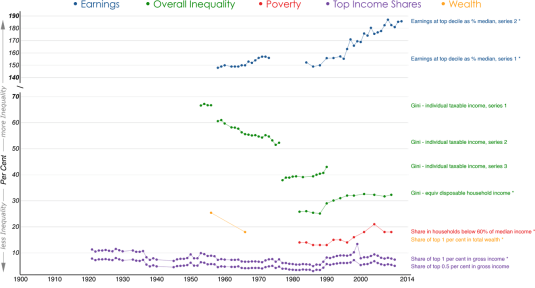
Figure 2: Australian inequality chart book
You are welcome to share but please refer to A. B. Atkinson and S. Morelli (2014) – ‘The Chartbook of Economic Inequality’ at http://www.ChartbookOfEconomicInequality.com
This visualisation is licensed under a Creative Commons BY-NC-SA license, Data visualisation by: Max Roser
20 Jan 2015 Leave a comment
in applied welfare economics, politics - Australia, politics - New Zealand, politics - USA Tags: Leftover Left, Oxfam, Thomas Piketty
20 Jan 2015 Leave a comment
in applied price theory, applied welfare economics Tags: top 1%
20 Jan 2015 Leave a comment
in applied welfare economics, politics - New Zealand, politics - USA, Public Choice Tags: advocacy bias, anti-capitalist mentality, Anti-Economics Left, Anti-Science left, expressive voting

There is often a curious distinction between what the scientific community and the general population believe to be true of dire scientific issues, and this skepticism tends to vary markedly across groups.
…What causes such radical group differences? We suggest, as have previous accounts, that this phenomenon is often motivated.
However, the source of this motivation is not necessarily an aversion to the problem, per se, but an aversion to the solutions associated with the problem.
This difference in underlying process holds important implications for understanding, predicting, and influencing motivated skepticism.
In 4 studies, we tested this solution aversion explanation for why people are often so divided over evidence and why this divide often occurs so saliently across political party lines.
Studies 1, 2, and 3—using correlational and experimental methodologies—demonstrated that Republicans’ increased skepticism toward environmental sciences may be partly attributable to a conflict between specific ideological values and the most popularly discussed environmental solutions.
Study 4 found that, in a different domain (crime), those holding a more liberal ideology (support for gun control) also show skepticism motivated by solution aversion.


HT: http://today.duke.edu/2014/11/solutionaversion and http://www.washingtonpost.com/blogs/wonkblog/wp/2014/11/10/conservatives-dont-hate-climate-science-they-hate-the-lefts-climate-solutions/
20 Jan 2015 Leave a comment
in applied price theory, applied welfare economics, economic growth, economic history, income redistribution, macroeconomics, Public Choice, public economics, rentseeking Tags: Leftover Left, Thomas Piketty
20 Jan 2015 Leave a comment
in applied price theory, applied welfare economics, economics of love and marriage, economics of marriage, labour economics Tags: assortative mating

The key research questions that reveal all are:
via Economists find rare empirical evidence of love in unique marriage survey.
20 Jan 2015 1 Comment
in applied price theory, applied welfare economics, law and economics, property rights, Public Choice, rentseeking, Richard Posner Tags: Frank Easterbrook, rent control, Richard Posner
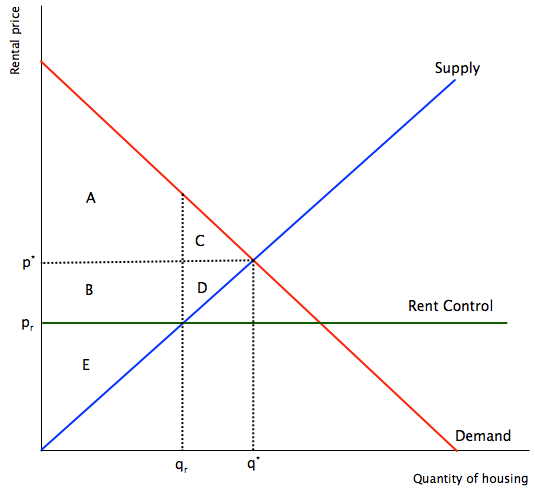
POSNER, Circuit Judge, with whom EASTERBROOK, Circuit Judge, joins in 819 F. 2d 732 – Chicago Board of Realtors Inc v. City of Chicago:
The stated purpose of the ordinance is to promote public health, safety, and welfare and the quality of housing in Chicago. It is unlikely that this is the real purpose, and it is not the likely effect.
Forbidding landlords to charge interest at market rates on late payment of rent could hardly be thought calculated to improve the health, safety, and welfare of Chicagoans or to improve the quality of the housing stock.
But it may have the opposite effect. The initial consequence of the rule will be to reduce the resources that landlords devote to improving the quality of housing, by making the provision of rental housing more costly. Landlords will try to offset the higher cost (in time value of money, less predictable cash flow, and, probably, higher rate of default) by raising rents. To the extent they succeed, tenants will be worse off, or at least no better off.
Landlords will also screen applicants more carefully, because the cost of renting to a deadbeat will now be higher; so marginal tenants will find it harder to persuade landlords to rent to them. Those who do find apartments but then are slow to pay will be subsidized by responsible tenants (some of them marginal too), who will be paying higher rents, assuming the landlord cannot determine in advance who is likely to pay rent on time. Insofar as these efforts to offset the ordinance fail, the cost of rental housing will be higher to landlords and therefore less will be supplied–more of the existing stock than would otherwise be the case will be converted to condominia and cooperatives and less rental housing will be built…
The provisions that authorize rent withholding, whether directly or by subtracting repair costs, may seem more closely related to the stated objectives of the ordinance; but the relation is tenuous. The right to withhold rent is not limited to cases of hazardous or unhealthy conditions. And any benefits in safer or healthier housing from exercise of the right are likely to be offset by the higher costs to landlords, resulting in higher rents and less rental housing.
The ordinance is not in the interest of poor people. As is frequently the case with legislation ostensibly designed to promote the welfare of the poor, the principal beneficiaries will be middle-class people.
They will be people who buy rather than rent housing (the conversion of rental to owner housing will reduce the price of the latter by increasing its supply); people willing to pay a higher rental for better-quality housing; and (a largely overlapping group) more affluent tenants, who will become more attractive to landlords because such tenants are less likely to be late with the rent or to abuse the right of withholding rent–a right that is more attractive, the poorer the tenant. The losers from the ordinance will be some landlords, some out-of-state banks, the poorest class of tenants, and future tenants.
The landlords are few in number (once owner-occupied rental housing is excluded–and the ordinance excludes it). Out-of-staters can’t vote in Chicago elections. Poor people in our society don’t vote as often as the affluent. See Filer, An Economic Theory of Voter Turnout 81 (Ph.D. thesis, Dept. of Econ., Univ. of Chi., Dec. 1977); Statistical Abstract of the U.S., 1982-83, at pp. 492-93 (tabs. 805, 806). And future tenants are a diffuse and largely unknown class.
In contrast, the beneficiaries of the ordinance are the most influential group in the city’s population. So the politics of the ordinance are plain enough, cf. DeCanio, Rent Control Voting Patterns,Popular Views, and Group Interests, in Resolving the Housing Crisis 301, 311-12 (Johnson ed. 1982), and they have nothing to do with either improving the allocation of resources to housing or bringing about a more equal distribution of income and wealth.
A growing body of empirical literature deals with the effects of governmental regulation of the market for rental housing. The regulations that have been studied, such as rent control in New York City and Los Angeles, are not identical to the new Chicago ordinance, though some–regulations which require that rental housing be "habitable"–are close. The significance of this literature is not in proving that the Chicago ordinance is unsound, but in showing that the market for rental housing behaves as economic theory predicts: if price is artificially depressed, or the costs of landlords artificially increased, supply falls and many tenants, usually the poorer and the newer tenants, are hurt…
20 Jan 2015 Leave a comment
in applied welfare economics, politics - New Zealand Tags: 2014 New Zealand election, child poverty, Gini coefficient, inequality and poverty, media bias, top 1%
Figure 1: Gini coefficient New Zealand 1980-2015

Source: Bryan Perry, Household incomes in New Zealand: Trends in indicators of inequality and hardship 1982 to 2013. Ministry of Social Development (July 2014).
Figure 2: Real household incomes (BHC), changes for top of income deciles, 1994 to 2013
![clip_image002[7]](https://utopiayouarestandinginit.com/wp-content/uploads/2014/12/clip_image0027_thumb.png?w=696&h=443)
Source: (Perry 2014).
Figure 3: Real equivalised median household income (before housing costs) by ethnicity, 1988 to 2013 ($2013).
![clip_image002[9]](https://utopiayouarestandinginit.com/wp-content/uploads/2014/12/clip_image0029_thumb2.png?w=686&h=452)
Source: (Perry 2014).

HT: http://www.listener.co.nz/current-affairs/new-deal-for-kids/


HT: http://i.stuff.co.nz/business/industries/10244667/Rich-poor-gap-not-growing-report
20 Jan 2015 Leave a comment
in applied welfare economics, development economics, growth disasters, growth miracles Tags: life expectancy
20 Jan 2015 Leave a comment
in applied welfare economics, politics - New Zealand, poverty and inequality Tags: Gini coefficient, poverty and inequality, top 1%
| Has the dispersion of earnings been increasing in recent decades? | Yes, the top decile has risen from 143 per cent of median in 1986 to 186 per cent in 2012. |
| Has overall inequality increased in recent years? | No, the Gini coefficient has been relatively stable around 32 percent since 1996. However, it rose by 7 percentage points between 1988 and 1996. |
| Have there been periods when overall inequality fell for a sustained period? | Yes, from mid-1950s to mid-1970s. |
| Has poverty been falling or rising in recent decades? | Poverty has substantially increased from 1996 to 2004 before decreasing mildly till 2009. |
| Has there been a U-pattern for top income shares over time? | Yes, top gross income shares fell from mid-1950s to mid-1980s, then rose from mid-1980s to mid-1990s. |
| Has the distribution of wealth followed the same pattern as income? | Insufficient evidence. |
| Additional noteworthy features | U-shape over post-war period. Top income shares estimates for the years 1998, 1999 and 2000 are affected by changes in the income tax laws. Top shares series have a break in 1951 (change in tax units). |

You are welcome to share but please refer to A. B. Atkinson and S. Morelli (2014) – ‘The Chartbook of Economic Inequality’ at http://www.ChartbookOfEconomicInequality.com
This visualisation is licensed under a Creative Commons BY-NC-SA license Data visualisation by: Max Roser
19 Jan 2015 Leave a comment
in applied price theory, applied welfare economics, development economics, growth disasters, growth miracles Tags: Davos, top 1%
18 Jan 2015 1 Comment
in applied welfare economics, economic history, gender, labour economics, Marxist economics
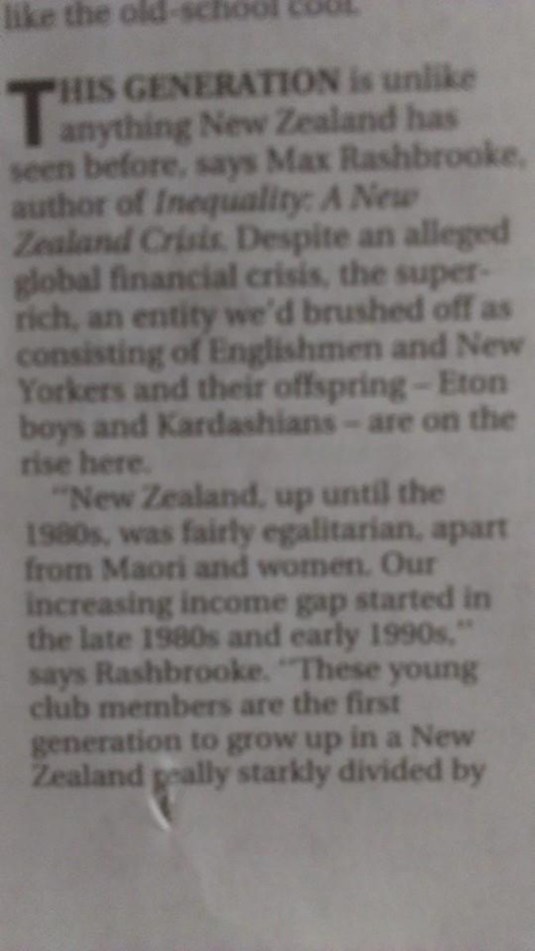
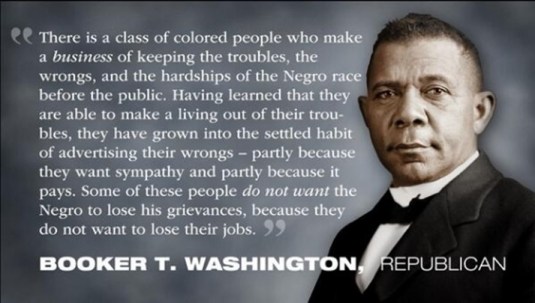
Max Rashbrooke is at it again in today’s Sunday Star Times – Wellington’s Sunday paper. He was painting pre-economic reform, pre-1984 New Zealand is a golden era of egalitarianism.
To do this, to paint pre-1984 New Zealand, pre-neoliberal New Zealand as a fairly egalitarian paradise, he only had to ignore up to two thirds of the population and the inequalities they suffered.
“New Zealand up until the 1980s was fairly egalitarian, apart from Maori and women, our increasing income gap started in the late 1980s and early 1990s,” says Rashbrooke. “These young club members are the first generation to grow up in a New Zealand really starkly divided by income.”
Racism and patriarchy can sit comfortably with a fairly egalitarian society if you are to believe the Left over Left.
As he implies in the paper today, captioned and quoted above, New Zealand in the 1980s was not fairly egalitarian for women, the majority of the population, and Māori, another 10% or so of the population.
This ignoring of racial and gender equality is very much in keeping with Max Rashbrooke’s boy’s own view of egalitarianism: women and ethnic minorities such as Māori and Pasifika don’t count in the greater scheme of the Left over Left when they whine and bitch about the Great Enrichment.
The mission in life of the Left over Left is desperately seeking poverty even if they drop out of the statistics most of the people who are no longer in poverty because of the Great Enrichment and the latest blessings of capitalism and freedom.
As shown in figure 1 below, between 1994 and 2010, real equivalised median New Zealand household income rose by 47%; for Māori, this rise was 68%; for Pasifika, the rise in real equivalised median household income was 77%.
Figure 1: Real equivalised median household income (before housing costs) by ethnicity, 1988 to 2013 ($2013)
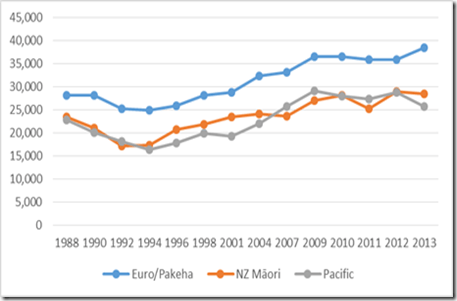
Source: Bryan Perry, Household incomes in New Zealand: Trends in indicators of inequality and hardship 1982 to 2013. Ministry of Social Development (July 2014).
Median household income increases of nearly 50% in 16 years, and larger increases for ethnic minorities such as Māori and Pasifika should be celebrated rather than simply ignored because they are inconvenient to Left over Left sniping.
As is common with every member of the Left over Left that I run into these days, such as Max Rashbrooke,, their analysis has no gender analysis.
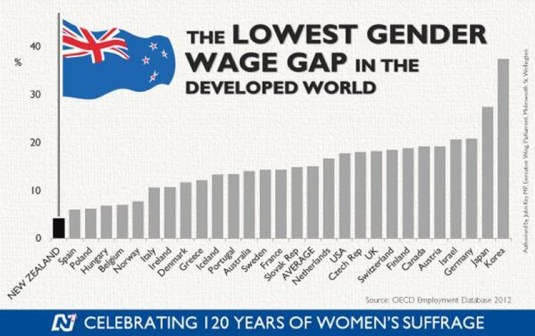
The Left over Left invariably fail to mention that New Zealand has the smallest gender wage gap of all the industrialised countries.
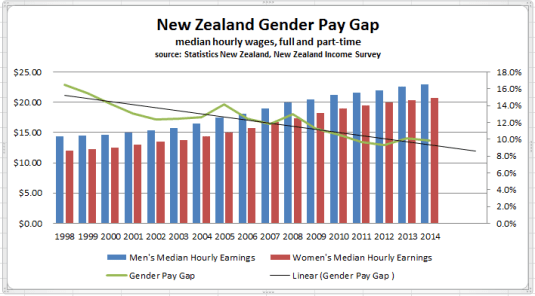
Sources: Ministry of Women’s Affairs and Statistics New Zealand: New Zealand Income Survey
Over the last more than two decades in New Zealand, there has been sustained income growth spread across all of New Zealand society contrary to hopes and dreams of the Left over Left.
Perry (2014) reviews the poverty and inequality data in New Zealand every year for the Ministry of Social Development. He concluded that:
Overall, there is no evidence of any sustained rise or fall in inequality in the last two decades. The level of household disposable income inequality in New Zealand is a little above the OECD median. The share of total income received by the top 1% of individuals is at the low end of the OECD rankings
18 Jan 2015 Leave a comment
in applied welfare economics Tags: culture and economic development, economics of personality traits

Since 2009, Gallup has been polling people in 150 countries and territories about their everyday emotional experiences.
The questions are things like, "did you smile or laugh a lot yesterday?", and "did you experience [enjoyment/physical pain/worry/sadness/stress/anger] during a lot of the day yesterday?"
Only 36 percent of Singaporeans reported experiencing either positive or negative emotions in a given day — making them the least emotional country in the world.
By contrast, the Philippines are the world’s most emotional country, with 60 percent saying they had either a positive or negative emotional experience on a given day.
HT: vox.com
A History of the Alt-Right
Econ Prof at George Mason University, Economic Historian, Québécois
Celebrating humanity's flourishing through the spread of capitalism and the rule of law
Scholarly commentary on law, economics, and more
Beatrice Cherrier's blog
Celebrating humanity's flourishing through the spread of capitalism and the rule of law
Celebrating humanity's flourishing through the spread of capitalism and the rule of law
Celebrating humanity's flourishing through the spread of capitalism and the rule of law
Why Evolution is True is a blog written by Jerry Coyne, centered on evolution and biology but also dealing with diverse topics like politics, culture, and cats.
Celebrating humanity's flourishing through the spread of capitalism and the rule of law
Celebrating humanity's flourishing through the spread of capitalism and the rule of law
A rural perspective with a blue tint by Ele Ludemann
DPF's Kiwiblog - Fomenting Happy Mischief since 2003
Celebrating humanity's flourishing through the spread of capitalism and the rule of law
The world's most viewed site on global warming and climate change
Tim Harding's writings on rationality, informal logic and skepticism
A window into Doc Freiberger's library
Let's examine hard decisions!
Commentary on monetary policy in the spirit of R. G. Hawtrey
Thoughts on public policy and the media
Celebrating humanity's flourishing through the spread of capitalism and the rule of law
Politics and the economy
A blog (primarily) on Canadian and Commonwealth political history and institutions
Reading between the lines, and underneath the hype.
Economics, and such stuff as dreams are made on
"The British constitution has always been puzzling, and always will be." --Queen Elizabeth II
Celebrating humanity's flourishing through the spread of capitalism and the rule of law
Celebrating humanity's flourishing through the spread of capitalism and the rule of law
WORLD WAR II, MUSIC, HISTORY, HOLOCAUST
Undisciplined scholar, recovering academic
Celebrating humanity's flourishing through the spread of capitalism and the rule of law
Res ipsa loquitur - The thing itself speaks
In Hume’s spirit, I will attempt to serve as an ambassador from my world of economics, and help in “finding topics of conversation fit for the entertainment of rational creatures.”
Researching the House of Commons, 1832-1868
Articles and research from the History of Parliament Trust
Reflections on books and art
Posts on the History of Law, Crime, and Justice
Celebrating humanity's flourishing through the spread of capitalism and the rule of law
Exploring the Monarchs of Europe
Cutting edge science you can dice with
Small Steps Toward A Much Better World
“We do not believe any group of men adequate enough or wise enough to operate without scrutiny or without criticism. We know that the only way to avoid error is to detect it, that the only way to detect it is to be free to inquire. We know that in secrecy error undetected will flourish and subvert”. - J Robert Oppenheimer.
The truth about the great wind power fraud - we're not here to debate the wind industry, we're here to destroy it.
Celebrating humanity's flourishing through the spread of capitalism and the rule of law
Celebrating humanity's flourishing through the spread of capitalism and the rule of law


Recent Comments