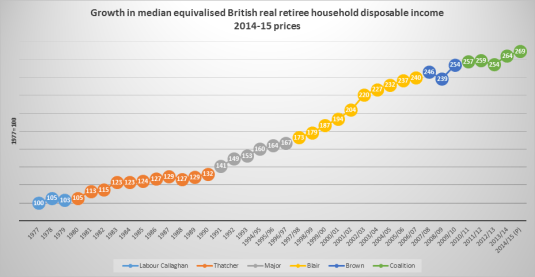
The British disease and the horrors of Thatchernomics past British retirees by as did pretty much the Global Financial Crisis. Slow and steady as she goes under every Prime Minister since 1977 has been year in year out result for the real disposable median incomes of British retired households. Despite it all, British retiree household incomes increased by 170% since the winter of discontent. The fastest growth in retiree incomes was under Tony Blair.
Source: Release Edition Reference Tables – ONS.
Notes:
1 Households are ranked by their equivalised disposable incomes, using the modified-OECD scale.
2 1994/95 represents the financial year ending 1995, and similarly through to 2014/15, which represents the financial year ending 2015.
3 Income figures have been deflated to 2014/15 prices using an implied deflator for the household sector.
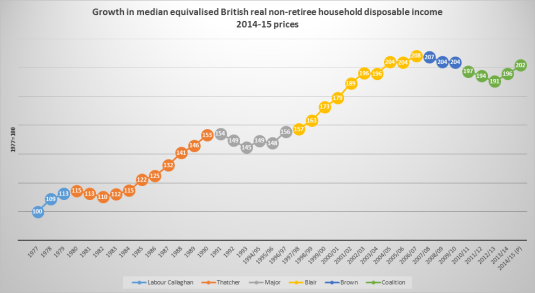
It has been a much rockier ride for British households yet to retire. Once again, the only time a sustained real income increases for non-retired households was under Thatcher and Blair. Despite it all, household real incomes have doubled since the winter of discontent. The majority of that doubling was under the dead hand of Tony Blair. British Labour now spends a considerable amount of time repudiating that time of unusually rapid household income growth across all of British society.
Source: Release Edition Reference Tables – ONS.
Notes:
1 Households are ranked by their equivalised disposable incomes, using the modified-OECD scale.
2 1994/95 represents the financial year ending 1995, and similarly through to 2014/15, which represents the financial year ending 2015.
3 Income figures have been deflated to 2014/15 prices using an implied deflator for the household sector.
The only two periods of sustained increases in median equivalised British real household disposable income is was under Mrs Thatcher, once she got going on Thatchernomics and under Tony Blair. Despite the ups and downs, real household incomes more than doubled in Britain since the winter of discontent. Equivalised income takes account of changes in the composition of households such as more single-parent households and fewer children since 1977.
Source: Release Edition Reference Tables – ONS. Notes: 1 Households are ranked by their equivalised disposable incomes, using the modified-OECD scale. 2 1994/95 represents the financial year ending 1995, and similarly through to 2014/15, which represents the financial year ending 2015. 3 Income figures have been deflated to 2014/15 prices using an implied deflator for the household sector
There is next to no gender wage gap even in unadjusted terms towards the bottom of the labour market. This is despite all the protestations of the Left of an inherent inequality of bargaining power between the bosses and workers.
The low paid are supposed to be powerless unless unionised. Declining unionisation is a leading explanation on the Left of the rising income shares of the top 10%, top 1% in the top 0.1%.
If that inherent inequality of bargaining power trundled out at every opportunity by the Twitter Left explains anything in the labour market, this inequality of bargaining power should be operating with greatest strength at the bottom of the labour market.
Clearly the inherent inequality of bargaining power between the bosses and workers is not doing its job regarding the gender wage gap. The gender wage gap in the USA increases as you move up the income ladder rather than the other way around.
It is interesting to note that the wage gap between genders is smaller at the 10th percentile than at the 95th. At the 10th percentile, women earn 91 percent of men’s wages while women make only 79 percent of men’s wages at the 95th percentile.
The minimum wage is partially responsible for this greater equality among the lowest earners—it sets a wage floor that applies to everyone, which means that people near the bottom of the distribution are likely to make more equal wages. Also, low-wage workers are disproportionately women, which means that the minimum wage particularly bolsters women’s wages.
…Although women have seen modest wage gains in the last several decades, the main reason the gender wage gap has slowly narrowed is that the vast majority of men’s wages have stagnated or declined.
It is a bit rich for the Economic Policy Institute to praise the minimum wage as a force for increasing incomes after spending so much of its time saying how the minimum wage has fallen way behind wages growth in general.
The gender gap lingers at the top of the labour market despite the quite substantial wage gains for women as compared to men over the past 15 years. The Economic Policy Institute dismissed the substantial gains as modest despite their own documenting of them.
It is even richer for the Economic Policy Institute to start extending the male wage stagnation hypothesis to the top 20% and top 10%.
The top of the income distribution has not been known previously known as victims of wage stagnation.
The gender wage gap remains stubbornly high at the top end of the US labour market at 20% for the last few decades. The gender wage is so large and has stayed large at the top half of the labour market for the past few decades because of compensating differentials. Women on higher incomes are balancing families and careers in choosing the occupations that best suits each individual woman, their talents and educational choices.
Studies of top earning professionals show that they make quite deliberate choices between family and career. The better explanation of why so many women are in a particular occupation is job sorting: that particular job has flexible hours and the skills do not depreciate as fast for workers who take time off, working part-time or returning from time out of the workforce. Low job turnover workers will be employed by firms that invest more in training and job specific human capital.
Higher job turnover workers, such as women with children, will tend to move into jobs that have less investment in specialised human capital, and where their human capital depreciates at a slower pace.
Women, including low paid women, select careers in jobs that match best in terms of work life balance and allows them to enter and leave the workforce with minimum penalty and loss of skills through depreciation and obsolescence.
This is the choice hypothesis of the gender wage gap. Women choose to educate for occupations where human capital depreciates at a slower pace. This gender wage gap for professionals can be explained by the marriage market combined with assortative mating:
Graduates are likely to marry each other and form power couples; and
There tends to be an age gap between men and women in long-term relationships and marriages of two years.
This two-year age gap means that the husband has two additional years of work experience and career advancement. This is likely to translate into higher pay and more immediate promotional prospects. Maximising household income would imply that the member of the household with a higher income, and greater immediate promotional prospects stay in the workforce.
This is consistent with the choice hypothesis and equalising differentials as the explanation for the gender wage gap. As Solomon Polachek explains:
At least in the past, getting married and having children meant one thing for men and another thing for women. Because women typically bear the brunt of child-rearing, married men with children work more over their lives than married women. This division of labour is exacerbated by the extent to which married women are, on average, younger and less educated than their husbands.
This pattern of earnings behaviour and human capital and career investment will persist until women start pairing off with men who are the same age or younger than them.
In low-paying jobs, there is little in the way of trade-offs other than full-time or part-time work. Low-paid jobs do not involve choosing majors at university, choosing careers, industries and employers that call for long hours and uninterrupted careers or not so long hours, fewer human capital and promotional penalties for time off and more work-life balance. The choice hypothesis is the far better explanation for the persistence of the unadjusted gender wage gap in the USA as Polachek explains:
The gender wage gap for never marrieds is a mere 2.8%, compared with over 20% for marrieds. The gender wage gap for young workers is less than 5%, but about 25% for 55–64-year-old men and women.
If gender discrimination were the issue, one would need to explain why businesses pay single men and single women comparable salaries. The same applies to young men and young women. One would need to explain why businesses discriminate against older women, but not against younger women. If corporations discriminate by gender, why are these employers paying any groups of men and women roughly equal pay?
Why is there no discrimination against young single women, but large amounts of discrimination against older married women? … Each type of possible discrimination is inconsistent with negligible wage differences among single and younger employees compared with the large gap among married men and women (especially those with children, and even more so for those who space children widely apart)
The main drivers of the gender wage gap are unknown to employers such as whether the would-be recruit or employer is married, their partner is present, how many children they have, how many of these children are under 12, and how many years are there between the births of their children.
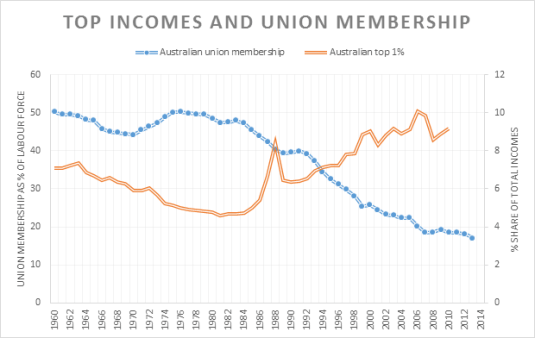
I thought I would check how this hypothesis travelled to European offshoots such as Australia and New Zealand. For example, in the USA, top income shares have been increasing while union membership has been in decline since 1960.
Source: OECD Stat and Top Incomes Database.
Source: OECD Stat and Top Incomes Database.
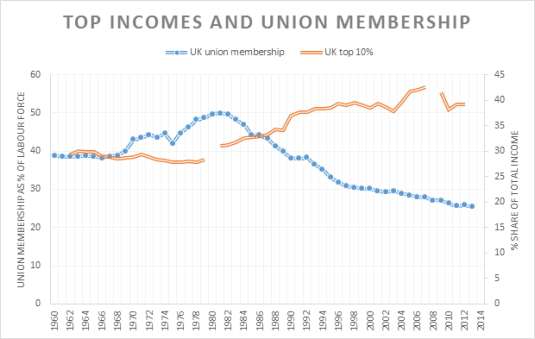
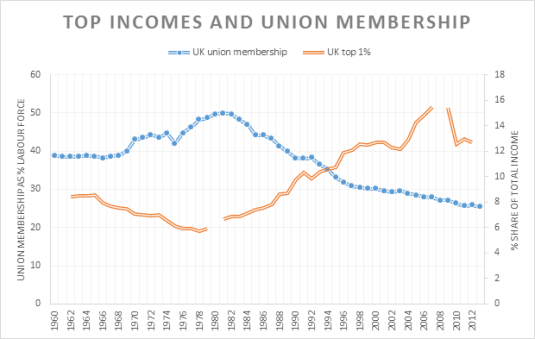
In the UK, the relationship between union membership and top incomes is gentler than in the USA.
Source: OECD Stat and Top Incomes Database.
Source: OECD Stat and Top Incomes Database.
Moving down under, the relationship between top incomes and union membership is non-existent in New Zealand.
Source: OECD Stat and Top Incomes Database.
Source: OECD Stat and Top Incomes Database.
The same pretty much goes for Australia in terms of no relationship between top incomes in union membership to extent that this relationship is anything more than a spurious correlation.
Medsafe denied New Zealanders access to four drugs approved in comparable regulatory jurisdictions in the last three years. Medsafe rejected two other drugs in the last three years but these drugs were not approved in comparable jurisdictions. Doxorubicin Liposomal, chemotherapy drug, is not as yet actually refused, its application is pending. Medsafe is not involved in the funding of medicines; this is the responsibility of PHARMAC.
Source: data released 29 October 2015 pursuant to an Official Information Act request to the Ministry of Health.
What’s the point of this regulatory arm of the Ministry of Health? Is it a waste of space? Should not New Zealand automatically register any drug approved in the USA, UK, Canada, Australia or Germany? What can medical trials in New Zealand find out were not already found out overseas? Medsafe targets processing applications for the approval of new drugs in New Zealand to be done within 200 days. That’s 200 days too many.
It should be lawful under the Medicines Act 1981 to market any drug in New Zealand which any of Australia, UK, USA, Canada or Germany has approved for prescription to patients.
SEEN & UNSEEN/ How much illness & death could be averted by limiting the FDA to safety, leaving efficacy to markets? http://t.co/4QkUuCCMDN— Robert Graboyes (@Robert_Graboyes) March 11, 2015
If economists have a bitter drinking song, a battle cry that unites the warring schools of economic thought all, it would be “how many people has the FDA killed today”. For example, drugs became available years after they were on the market outside the USA because of drug approval lags at the FDA. The dead are many. To quote David Friedman:
In 1981… the FDA published a press release confessing to mass murder. That was not, of course, the way in which the release was worded; it was simply an announcement that the FDA had approved the use of timolol, a ß-blocker, to prevent recurrences of heart attacks. At the time timolol was approved, ß-blockers had been widely used outside the U.S. for over ten years. It was estimated that the use of timolol would save from seven thousand to ten thousand lives a year in the U.S. So the FDA, by forbidding the use of ß-blockers before 1981, was responsible for something close to a hundred thousand unnecessary deaths.
In 1962, an amended law gave the FDA authority to judge if a new drug produced the results for which it had been developed. Formerly, the FDA monitored only drug safety. It previously had only sixty days to decide this. Drug trials can now take up to 10 years.
Sam Peltzman showed in a famous paper in 1973 that these 1962 amendments reduced the introduction of new drugs in the USA from an average of forty-three annually in the decade before the 1962 amendments to sixteen annually in the ten years afterwards. No increase in drug safety was identified.
Medsafe is a cost with no benefits to the New Zealand public. Medsafe has around 60 staff operating out of two offices, with centralised administrative functions, product approval and standard setting at the head office in Wellington.
How much of this budget of several million for Medsafe could be redirected to funding more life-saving and life changing drugs for use in New Zealand? This is rather than wasted on duplicating clinical trials already completed overseas or at the minimum duplicating regulatory approval processes, paperwork already completed overseas but not requiring a duplicate clinical trial in New Zealand.
At a minimum, the net benefits of the entire drug approval framework over the past three years in New Zealand is riding out on rejecting for approval half a dozen drugs, four of which are approved as safe in other comparable jurisdictions. That’s a pretty thin reed on which to hang a large budget that could be used by PHARMAC to fund life-saving drugs.
There should be a post box at the Ministry of Health to receive the certifications from overseas drug regulation agencies. Anything more is a deadly waste of taxpayers’ money.
My next round of Official Information Act requests will ask whether the minister and associate ministers of health were briefed on refusals of new medicines approved in other jurisdictions. Next I will ask:
for any evidence that a separate regulatory authority for drug approvals in New Zealand has any benefits, and
whether the Medsafe regime has ever been subject to a cost benefit analysis.
I have previously asked for information on drug approval lags. That was refused on the grounds I can look it up for myself on a rather complicated public database that requires knowledge of the names of medicines submitted for approval. Still mulling over what to do about that.
In 1967, only 1 in 12 US households made $100k or more per year (in 2014 dollars). Now 1 in 4 household make $100k+ https://t.co/OPnZcRsR3y— Mark J. Perry (@Mark_J_Perry) October 26, 2015
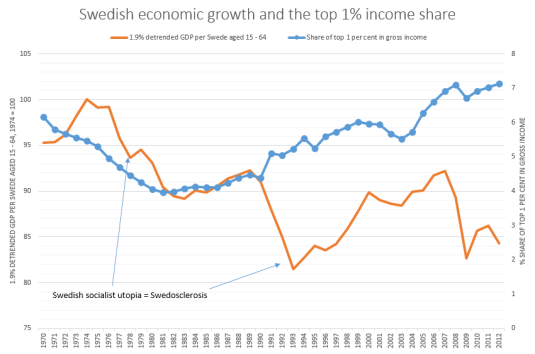
A fall in the share of the top 1% of total Swedish total incomes was in tune with the emergence of a new word in the English language which was Swedosclerosis. That was the long stagnation in the Swedish economy in the 1970s and the 1980s with Swedish economic growth well below that in the trend rate of growth in the USA. Only after an increase in the top 1% share in Sweden did economic growth start recovering to trend.
In the chart above, a flat-line in real GDP per working age Swede is growth at the trend rate of the US economy for the 20th century which was 1.9% per year. A falling line is Swedish growth below trend, a rising line is growth above that trend rate of 1.9% in Sweden. A trend rate of 1.9% is the trend rate of growth currently used by Edward Prescott for the USA in the 20th century.
Why Evolution is True is a blog written by Jerry Coyne, centered on evolution and biology but also dealing with diverse topics like politics, culture, and cats.
In Hume’s spirit, I will attempt to serve as an ambassador from my world of economics, and help in “finding topics of conversation fit for the entertainment of rational creatures.”
“We do not believe any group of men adequate enough or wise enough to operate without scrutiny or without criticism. We know that the only way to avoid error is to detect it, that the only way to detect it is to be free to inquire. We know that in secrecy error undetected will flourish and subvert”. - J Robert Oppenheimer.


Recent Comments