
Payoff from Paris @COP21 @garethmorgannz @jamespeshaw @greenpeaceNZ @RusselNorman
17 Nov 2015 Leave a comment
in applied welfare economics, environmental economics, global warming
Deirdre McCloskey on Piketty, the Bourgeoisie Deal, the Bolshevik Deal, and the Bridal Deal
17 Nov 2015 Leave a comment
in applied price theory, applied welfare economics, comparative institutional analysis, constitutional political economy, development economics, economic history, economics of bureaucracy, growth disasters, growth miracles, Public Choice Tags: bourgeoisie deal, capitalism and freedom, Deirdre McCloskey, industrial revolution, The Great Enrichment, The Great Escape, The Great Fact, Thomas Piketty

.
What does @Walmart do wrong but @APPLEOFFIClAL does right?
16 Nov 2015 Leave a comment
in applied price theory, applied welfare economics, entrepreneurship, industrial organisation, politics - USA Tags: Apple, creative destruction, entrepreneurial alertness, Left-wing hypocrisy, Leftover Left, superstar wages, superstars, top 1%, Twitter left, Walmart
@JohnQuiggin on “How New Zealand fell further behind” @FairnessNZ
15 Nov 2015 1 Comment
in applied welfare economics, economic growth, economic history, economics of regulation, fiscal policy, labour economics, politics - New Zealand Tags: Australia, John Quiggin, lost decades
Leading Australian academic economist John Quiggin has just published an article arguing that New Zealand should not be a policy role model for anything. To quote Quiggin:
For most of the twentieth century, the New Zealand and Australian economies performed almost identically. New Zealand took a somewhat larger hit when Britain entered the European Common Market in the 1970s, but that impact has long since washed out. The real divergence came in the 1980s. Since then, New Zealand’s income per person has fallen 35 per cent behind Australia’s
He used Reserve Bank of New Zealand data going back to 1990, which is common starting point for most Reserve Bank data.
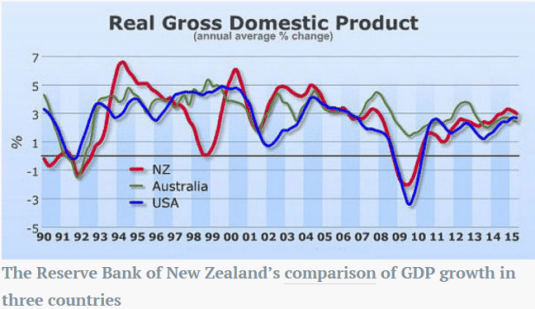
Source: John Quiggin “How New Zealand fell further behind”. Inside Story, 11 November 2015.
If he had taken that chart back to the 1970s and earlier using the Conference Board Total Database, Quiggin would have found that New Zealand economy diverged from Australia in the 1970s, not in the 1980s. His data from the Reserve Bank of New Zealand started at the low point in 1990 – at the end of that divergence that started in 1974. The New Zealand economy was depressed between 1974 and 1992. I label this Great Depression in New Zealand as New Zealand’s Lost Decades.
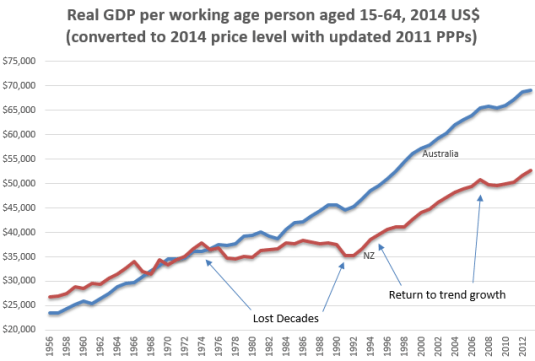
Source: Computed from OECD Stat Extract and The Conference Board. 2015. The Conference Board Total Economy Database™, May 2015, http://www.conference-board.org/data/economydatabase/
Real GDP PPP per working age New Zealander fell rapidly after 1974 (a 34% drop against trend) when that economy was a heavily regulated, highly taxed economy. This heavily regulated, highly taxed, economically stagnant New Zealand is the good old days in the eyes of the Twitter Left.
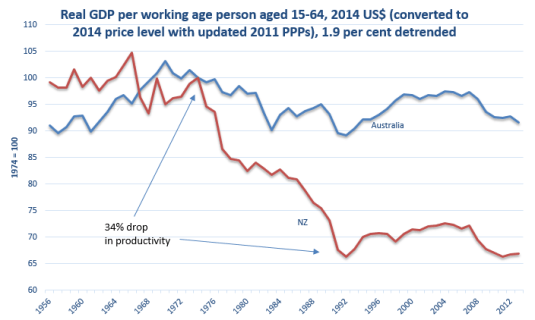
Source: Computed from OECD Stat Extract and The Conference Board. 2015. The Conference Board Total Economy Database™, May 2015, http://www.conference-board.org/data/economydatabase/
In the chart above, the base is 1974 which equals 100. A flat-line means annual growth equal to the trend rate of growth in the 20th century for the USA. A falling line means below trend growth; a rising line means above trend rate economic growth per working age Australian or New Zealander.
With the election of a National Party government in 1990 and a massive fiscal consolidation, New Zealand growth rate returned to the previous trend rate of 1.9% in 1992. Ruth Richardson’s horror budget of 1991 was so bad that the what became the Twitter Left called it the “Mother of All Budgets“.
What followed this massive fiscal consolidation where welfare benefits for cut severely was an economic boom that lasted until the GFC.
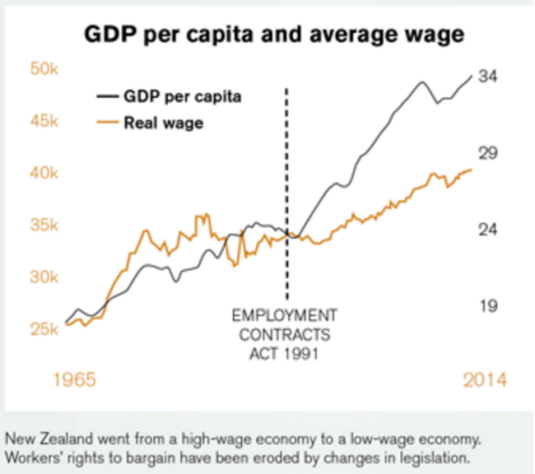
Source: Income Gap | New Zealand Council of Trade Unions – Te Kauae Kaimahi.
As shown in the chart conveniently compiled by the New Zealand Council of Trade Union, there was 20 years of real wage stagnation until the passage of the Employment Contracts Act in 1991.
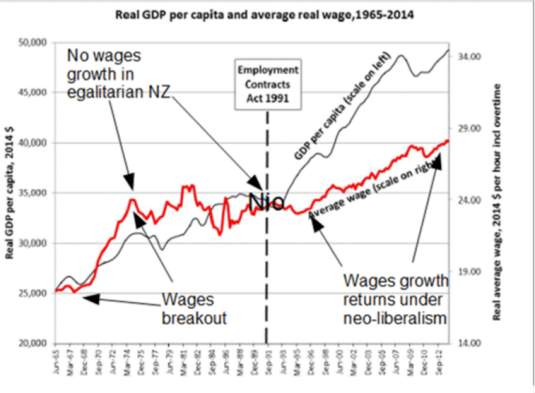
Source: Income Gap | New Zealand Council of Trade Unions – Te Kauae Kaimahi with annotations.
What followed the passage of that Act was sustained real wages growth for the first time in two decades and the end of growing inequality under the previously highly taxed, heavy regulated economy that was good old days New Zealand if the Twitter Left is to be believed.
To do this, to paint pre-1984 New Zealand, pre-neoliberal New Zealand as a fairly egalitarian paradise, Max Rashbrooke is an example of that is had to ignore two thirds of the population and the inequalities they suffered:
“New Zealand up until the 1980s was fairly egalitarian, apart from Maori and women, our increasing income gap started in the late 1980s and early 1990s,” says Rashbrooke. “These young club members are the first generation to grow up in a New Zealand really starkly divided by income.”
Racism and patriarchy can sit comfortably with a fairly egalitarian society if you are to believe the vision of the Twitter Left as to their good old days. John Quiggin refers to the period in Australia known as the Menzies Era as part of his golden age of the mixed economy. The Menzies Era was most of the 23 years of uninterrupted conservative party rule between 1949 and 1972. The actual Menzies Era was the period up to 1966 when Liberal Party Prime Minister Sir Robert Menzies retired
The reforms of the 1980s known as Rogernomics stopped the long-term stagnation in real wages that started in about 1974. The reforms of the early 1990s under a National Party government including a massive fiscal consolidation and the passing of the Employment Contracts Act was followed by the resumption of sustained growth in real wages with little interruption since.
New work by Chris Ball and John Creedy shows substantial *declines* in NZ inequality.
initiativeblog.com/2015/06/24/ine… http://t.co/f94fw4Bhae—
Eric Crampton (@EricCrampton) June 24, 2015
This boom after two decades of minimal real economic growth per working age New Zealander benefited everyone. The unemployment rate fell to a record low of 3.5% about 2005. Maori unemployment was at a 20-year low of 8% in 2008. Maori labour force participation rates increased from 45% in the late 1980s to about 62% by the eve of the Global Financial Crisis.
The increase in percentage terms of Maori and Pasifika real household income is much larger than for Pakeha since the economic reforms of the 1980s and 1990s. As Bryan Perry (2015, p. 67) explains when commenting on table D6 sourced by Closer Together Whakatata Mai:
From a longer-term perspective, all groups showed a strong rise from the low point in the mid 1990s through to 2010. In real terms, overall median household income rose 47% from 1994 to 2010: for Maori, the rise was even stronger at 68%, and for Pacific, 77%. These findings for longer- term trends are robust, even though some year on year changes may be less certain. For 2004 to 2010, the respective growth figures were 21%, 31% and 14%.
Creative destruction in British manufacturing employment
13 Nov 2015 Leave a comment
in applied price theory, applied welfare economics, economic history, industrial organisation, labour economics, labour supply, survivor principle Tags: British economy, British history, creative destruction, endogenous growth theory, labour reallocation, technological unemployment
@dsmitheconomics @thesundaytimes In mid-60s, about a third of workers were employed in manufacturing. Now 8%! http://t.co/ipmr7XvIme—
Andrew Sentance (@asentance) July 12, 2015
@tslumley on spending ½ PHARMAC budget on one semi-wonder drug @PeterDunneMP
13 Nov 2015 2 Comments
in applied price theory, applied welfare economics, health economics, politics - New Zealand
Thomas Lumley wrote a great post today on the unavoidably brutal arithmetic of rationing the budget of PHARAC – the New Zealand government agency that buys drugs for the public health system.
Would you spend $200,000 per drug for two thousand melanoma cancer patients. It doesn’t work 66% of the time, but helps 34% of patients and cures 6% of patients.
The trick in the tail is funding the drug would cost half the entire budget of PHAMRAC.

Many more wonder drugs, more correctly, semi-wonder drugs coming down the pipe, so these life or death decisions will not get any fewer in a world of scarcity.
In 1979, Gordon Tullock wrote a 1979 New York Law Review book about avoiding difficult choices. As per Gordon Tullock, he barely mentioned the books are mainly discussed as a stream of consciousness his reactions to the book. His review was a review of a book by Guido Calabresi and Philip Bobbitt called Tragic Choices which was about the rationing: the allocation of kidney dialysis machines (a “good”), military service in wartime (a “bad”), and entitlements to have children (a mixed blessing). Tullock argued that we make a decision about:
- how to allocate resources,
- how to distribute the resources, and
- how to think about the previous two choices.
People do not want to face up to the fact resources are scarce and they face limits on their powers.
To reduce the personal distress of making these tragic choices, Tullock observed that people often allocate and distribute resources in a different way so as to better conceal from themselves the unhappy choices they had to make even if this means the recipients of these choices are worse off and more lives are lost than if more open and honest choices about there are can only be so much that can be done.
The increasing number of both wonder drugs and semi-wonder drugs that cost the earth will increase the importance of facing up to difficult choices more honestly than in the past.
Do the European welfare states free ride off American entrepreneurship and innovation?
12 Nov 2015 1 Comment
in applied price theory, applied welfare economics, comparative institutional analysis, constitutional political economy, economic history, economics of regulation, entrepreneurship, industrial organisation, politics - USA, public economics, survivor principle, taxation, technological progress Tags: creative destruction, Daron Acemoglu, Denmark, entrepreneurial alertness, Eurosclerosis, international technology diffusion, taxation and entrepreneurship, taxation and innovation, taxation and investment, taxation and labour supply, technology followers, welfare state

Source: Daron Acemoglu A Scandinavian U.S. Would Be a Problem for the Global Economy – NYTimes.com.
Unions – not the cause of our 40 hour workweek
10 Nov 2015 Leave a comment
in applied price theory, applied welfare economics, economic history, entrepreneurship, health and safety, human capital, industrial organisation, labour economics, labour supply, Marxist economics, minimum wage, politics - Australia, politics - New Zealand, politics - USA, poverty and inequality, unions Tags: The Great Enrichment, union power, union wage premium
The Great Fact in 2 charts
10 Nov 2015 Leave a comment
in applied welfare economics, development economics, economic history, growth disasters, growth miracles Tags: China, India, The Great Escape, The Great Fact
Self-driving cars – a surprising quirk in the cost benefit analysis
09 Nov 2015 Leave a comment
in applied welfare economics, health economics, transport economics

The Real World Effects Of Unions @FairnessNZ @PeetzDavid
09 Nov 2015 Leave a comment
in applied price theory, applied welfare economics, labour economics, labour supply, Milton Friedman, unemployment, unions Tags: union membership, union power, union wage premium
Did @MaxRashbrooke make his case for wealth and inheritance taxes?
08 Nov 2015 2 Comments
in applied price theory, applied welfare economics, politics - New Zealand, public economics
Veteran left-wing grumbler Max Rashbrooke yesterday argued for a wealth tax and inheritance taxes in New Zealand because of a widening wealth gap. He wants to tax inheritances of more than a mere $200,000 over your lifetime!
Yeah, I mean, we really are an international outlier in the sense that we don’t really tax wealth in any form. We don’t tax capital gains except now in very limited circumstances. We don’t tax inheritances. We don’t tax gifts. We don’t tax wealth in general, and this is a complicated area. In a lot of countries inheritance taxes are falling out of fashion. They get called death taxes and that kind of thing. But in response to that, what a lot of people are talking about are things like kind of a lifetime capital receipts tax. So rather than taxing the giver, you tax the recipient, and you say, ‘Look, over your lifetime, you can inherit, say, $200,000 tax free,’ so that your parents can pass on a bit to you.
That means an inheritance tax on the family home given current house prices in Auckland and Wellington and small families. I can’t see the Labour Party or even the Greens following him in on that one if they want to win office ever again.
Did Rashbrooke make a case for a widening wealth gap by looking at a 2004 survey of income and wealth?
Currently, the most recent publicly available information on wealth inequality in New Zealand comes from the 2004 round of the Survey of Family, Income and Employment, known as Sofie… Because wealthy people often refuse to take part in surveys such as Sofie, such data tends to underestimate how much of the pie is owned by the wealthiest people and overstate the share of everyone else. But it is still the best data we have.
Rashbrooke used this 2004 survey to draw a number of conclusions about the distribution of wealth in New Zealand:
The wealthiest tenth of individuals (including that wealthiest one per cent) had 52 per cent of all assets. In contrast, the poorest half of the country had just five per cent of all wealth. Some 190,000 people had negative net worth (more debts than assets), owing $4.7 billion between them.
Did Rashbrooke make his case that there is 52% of all assets in New Zealand are held by the wealthiest 10%? He did not because his definition wealth is too incomplete. Because of that, his focus on inheritance taxes and wealth taxes as solutions are equally poorly made. Any definition of wealth including that by Rashbrooke that doesn’t include human capital or acknowledge the limitations of not including human capital isn’t worth serious attention in public policy circles.

Source: Gary Becker, ‘Give Us Your Skilled Masses’ (2005).
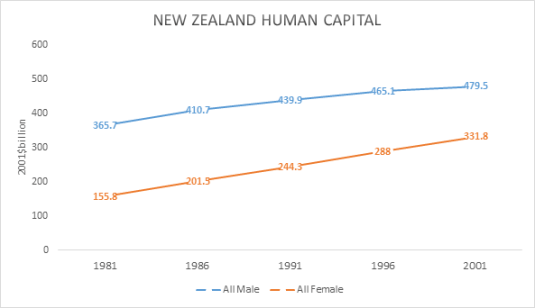
Rashbrooke ignores 70% of the capital, the wealth in any economy. Gary Becker’s estimate that human capital is 70% of all capital in the US economy travels well to New Zealand as shown in the chart below.
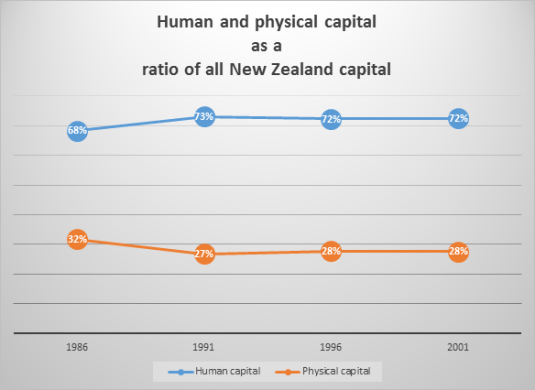
Source: Lˆe Thi. Vˆan Tr`ınh, Estimating the monetary value of the stock of human capital for New Zealand, University of Canterbury PhD thesis (September 2006), Table 4.8: Human and physical capital stocks.
Over 70% of all capital in New Zealand is human capital. That cannot be ignored in any discussion of a widening wealth gap or in a case for inheritance and wealth taxes.
Dollar value estimates were available to Rashbrooke of human and physical capital of the same vintage as his wealth data from an excellent New Zealand PhD thesis by Lˆe Thi. Vˆan Tr`ınh. Her estimates of the aggregate dollar value of New Zealand physical and human capital are charted below. These estimates show that physical capital doubled between 1981 and 2001 but New Zealand human capital quadrupled.

Source: Lˆe Thi. Vˆan Tr`ınh, Estimating the monetary value of the stock of human capital for New Zealand, University of Canterbury PhD thesis (September 2006), Table 4.8: Human and physical capital stocks.
The rich are clearly not getting richer and the poor getting poorer and some people have no wealth at all. Human capital is the dominant form of capital in New Zealand and is growing rapidly. Any discussion of wealth does not include estimates of human capital or acknowledge the limitations of not having those estimates, which are easily available, should not be considered in public policy debates on inequality.
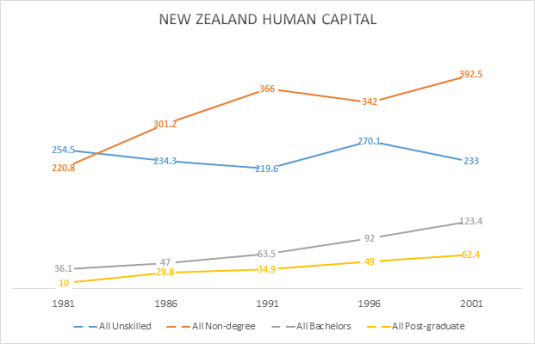
Source: Lˆe Thi. Vˆan Tr`ınh, Estimating the monetary value of the stock of human capital for New Zealand, University of Canterbury PhD thesis (September 2006).
The only group in New Zealand that doesn’t have more human capital in 2001 than in 1981 were the unskilled as the chart above shows. This was because their numbers dropped by one-third as a share of the working age population.

Source: Lˆe Thi. Vˆan Tr`ınh, Estimating the monetary value of the stock of human capital for New Zealand, University of Canterbury PhD thesis (September 2006), table 3.1.
I don’t think a solution to skills gaps is to increases taxes on those who investing in human capital. But that is the logic of Rashbrooke. When someone gets ahead, drag them back down rather than lift everybody up.
The reason for the lack of growth in the dollar value of unskilled human capital is the massive increase in investment in higher education in New Zealand. More New Zealanders go to university, Polytech or other diploma education. Working class New Zealanders are taking the advice of that unrepentant Stalinist but brilliant screenwriter Dalton Trumbo.

What is most disappointing is the unrepentant lack of gender analysis in the writings of Max Rashbrooke on inequality and wealth. Without a gender analysis, no discussion of wealth and inequality in New Zealand has any meaning.
Few labour market statistics have any meaning unless broken down by gender. Whenever you don’t see statistics with a gender breakdown, the first question for any sort of credible audience is “Gender analysis! Gender analysis! Where is your gender analysis?”
Max Rashbrooke inadvertently illustrated the meaningless of statistics that don’t have a gender analysis when griping recently about poverty and inequality in New Zealand as compared to the good old days before the economic reforms of the 1980s.
To paint pre-1984 New Zealand, pre-neoliberal New Zealand as an egalitarian paradise, Rashbrooke had to ignore two thirds of the population. He brushed over the inequalities they suffered in the heavily regulated, heavily taxed economy so looked upon with dewy eyes by the left of politics:
“New Zealand up until the 1980s was fairly egalitarian, apart from Maori and women, our increasing income gap started in the late 1980s and early 1990s,” says Rashbrooke. “These young club members are the first generation to grow up in a New Zealand really starkly divided by income”.
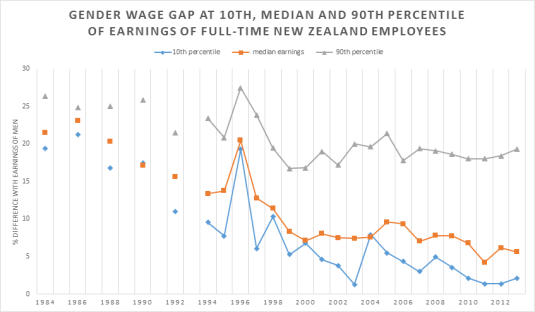
Racism and patriarchy can sit comfortably with a fairly egalitarian society if you are to believe a leading spokesman of the Left. I disagree as would John Rawls with this boy’s own view of trends in New Zealand inequality. Boy’s own because trends in gender inequality are not discussed. No weight is given to the closing of the gender pay gap, a massive increase in female employment and women out-numbering male university new graduates for well over a decade.

Perry (2014) reviews the poverty and inequality data in New Zealand every year for the Ministry of Social Development. He concluded that:
Overall, there is no evidence of any sustained rise or fall in inequality in the last two decades. The level of household disposable income inequality in New Zealand is a little above the OECD median. The share of total income received by the top 1% of individuals is at the low end of the OECD rankings.
As there is no evidence of any sustained rise or fall on inequality New Zealand for the last 20 years, the case for inheritance and wealth taxes simply doesn’t get out of the box.
Source: OECD Employment Database.
That case for inheritance and wealth taxes by Max Rashbrooke doesn’t deserve to get into the box to go under starter’s orders if that analysis doesn’t include an analysis of human capital and a gender analysis. For example, male human capital increased by 31% in New Zealand between 1981 and 2001. Over the same period, female human capital increased by 112%. This not insignificant achievement in gender empowerment by capitalism and freedom bears celebration in any discussion of inequality.
Source: Lˆe Thi. Vˆan Tr`ınh, Estimating the monetary value of the stock of human capital for New Zealand, University of Canterbury PhD thesis (September 2006).
The only group of women for whom the gender pay gap has not all but disappeared over the last 30 years are the top 10% of women. This is the very group that Max Rashbrooke wants to tax heavily to prevent them accumulating and inheriting wealth.
The reason for those taxes on wealth and inheritances on successful women in the professions and business is growth in inequality but there is little to no evidence of that in New Zealand for at least 20 years.
How many of the richest Americans inherited their fortune? Find out. buff.ly/1DNM3g2 http://t.co/QlarE5yAdT—
HumanProgress.org (@humanprogress) August 14, 2015
The case of wealth and inheritance taxes as a way of coping with inequality is just not keeping up with recent trends in superstar wealth. New Zealand top 1% is lazy when compared to their more entrepreneurial American brothers.
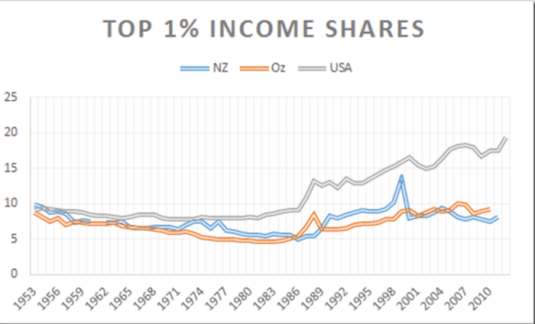
Source: The World Top Incomes Database.
Our local top 1% earns the same share of total income as 30 years ago or even 60 years ago. Any growth in wealth gaps in New Zealand isn’t showing up in top incomes shares.

Source: The World Top Incomes Database.
As for overseas, Piketty and Saez (2003) concluded that a substantial fraction of the rise in top incomes was due to surging top wage incomes. These world-renowned social economists concluded that top executives (the ‘working rich‘) replaced top capital owners (the ‘rentiers’) at the top of the income hierarchy in the USA and Canada. The largest portion of the top incomes comes from earning wages. Top wage earners work for their living founding, building and/or directing successful businesses.

Swedish and Danish top incomes & union decline @FlipChartRick @EconomicPolicy @PoliticalSift
04 Nov 2015 Leave a comment
in applied price theory, applied welfare economics, econometerics, entrepreneurship, labour economics, Public Choice, rentseeking, unions Tags: Denmark, labour surplus, Sweden, top 1%, union power, union wage premium
The Danish top 1% and top 10% is even lazier than their transnational co-conspirators. No success at all at either grinding the Danish unions down or extracting more labour surplus from the long-suffering Danish proletariat.

Source: OECD StatExtract and Top Incomes Database.

Source: OECD StatExtract and Top Incomes Database.
The Swedish top 10% and top 1% have done a bit better since the economic liberalisation in that country from the early 1990s. But none of that additional labour surplus has anything to do with grinding the unions down because Swedish union membership has not declined.

Source: OECD StatExtract and Top Incomes Database.

Source: OECD StatExtract and Top Incomes Database.

Recent Comments