Morgan Foundation researchers Jess Berentson-Shaw and Geoff Simmons were good enough to write a long reply to my recent post on the role of unconscious bias in the gender wage gap. My post was in reply to a Friday whiteboard session by Geoff Simmons.
I thought the best way to start is to summarise their reply in terms of how my rejoinder will be structured:
- There is a persistent, known but unexploited entrepreneurial opportunity for pure profit arising from employers not hiring women on merit because of an unconscious bias against them. This unconscious bias among employers against women explains 20-30% of the gender wage gap. Most of the rest of that gap is due to factors such as differences in occupation and education.
- The gender wage gap is smaller at the bottom of the labour market because of the minimum wage.
- The gender wage is smaller in the middle than at the top of the labour because of “far more standard contracts in the middle”. I take this to mean recruiting firms set a hiring standard and make a wage offer. This does not mean they have a free hand in their wage posting. A higher wage offer attracts better qualified applicants. Posting a low wage attracts fewer candidates that meet their hiring standard from other jobs and from the ranks of the unemployed. The available evidence suggests that one-third of job matches are based on wage bargaining and two-thirds through wage posting. Wage posting is more common in larger firms, the public sector and where there is collective bargaining. Wage bargaining is more profitable for occupations and jobs with a high dispersion in workers’ skills and productivity and in tighter labour markets.
- The gender pay gap is largest for the top 10% of female wage earners because “… what scientific evidence supports the argument that better paid women have the ability to negotiate pay & conditions better? The very fact that there is a consistent and large gap between highly paid men and women suggests that where MORE negotiation, discretion, more complex selection processes are involved the more women are discriminated against”. The available evidence is wage posting is less common the more skilled is the worker. It pays to invest more in scrutinising recruits against hiring standards and to consider offer matching when the wage is higher for applicants and for employees threatening to quit. The payoff from a longer job search is greater the higher is the wage. There is a greater chance of higher skilled jobseeker of finding a better paid match between their more idiosyncratic skills and backgrounds in vacancies elsewhere or which might appear later. Low skilled jobseekers invest less in job search because one vacancy is frequently as good as another in their occupational and industry labour markets. The higher skilled are also more geographically mobile than the low skilled and more likely to live in cities and earn the urban wage premium.
- “Better paid professional women may have more options than lower paid women but they still have fewer than their male equivalents.” I take this to mean the greater the ability of workers to move from employer to employer, the better are they paid. Women have a weaker average attachment to the labour market. The human capital interpretation of this is woman and mothers in particular have lower productivity because they have spent less time accumulating on-the-job human capital. In the search and matching interpretation, women have less search capital. Workers start out as job shoppers: the longer a worker shops around, the more likely after a succession of job matches that they chance upon better paying job and occupational matches. Women through career interruptions for motherhood spend less time in the labour market, accumulate less search capital and are therefore are paid less. Women find it harder to work their way into the better-paying job matches.
- “Removing unconscious bias requires cultural change and will take time to resolve but it is possible to do with concerted effort.” This as example of what Adam Smith called the overweening conceit of youth.
My reply to the original Friday whiteboard session by Geoff Simmons relied on invisible hand explanations. Nozick argued that invisible hand explanations of social phenomena must have a filter and an equilibrating mechanism.
Geoff Simmons’ hypothesis about the gender wage gap is an invisible hand explanation: 20-30% of the gender wage gap is driven by unconscious bias. There could be no greater an invisible hand than an unconscious one.
There must be a mechanism in Geoff Simmons’ hypothesis that guides market participants to not hire and not promote women on merit. Not hiring on merit forfeits profit. There must be a filter that penalise hiring on merit.
The market has a filter and an equilibrating mechanism that constitute its invisible hand. The equilibrating mechanism – the mechanism that prompts people to hire on merit – is price signals. Prices are a signal wrapped in an incentive. If prices go up, buy less and look for other options, if they go down, buying more is profitable. The filter, which is more of an invisible punch than an invisible hand, is profits and losses. Higher costs, lower profits, loss of market share, insolvency and bankruptcy drive out the entrepreneurs who fail to hire on merit.
Entrepreneurs that hire on merit are more likely to survive in market competition than those that do not. Entrepreneurs must adapt or die.
There is no similar institutional filter in Geoff Simmons hypothesis to ensure that not hiring on merit is the unintended outcome from the decentralised behaviour of countless employers and job seekers trying to improve their own circumstances. Self-interested employers are not prompted by price signals to not hire on merit. More importantly, their chances are surviving in market competition are increased rather than are reduced if employers resist the temptations arising from their unconscious biases against women.
This institutional context is the reverse of what should be for unconscious bias against women to survive in market competition as suggested by Geoff Simmons. Firms that hire on merit should have a lower probability of survival, not a higher chance of staying in business if the unconscious bias hypothesis is to prevail in the face of market competition.
Geoff Simmons and Jess Berentson-Shaw is they didn’t address my extensive comments about the market as an evolutionary process. They did not explain how market competition would not penalise employers who fail to hire on merit for any reason including unconscious bias. That is the fundamental flaw, a fatal flaw in their reply to my comment on their Friday whiteboard session.
Most of all, Geoff Simmons and Jess Berentson-Shaw succumb to what Robert Nozick christened normative sociology. This is the study of what the causes of social problems ought to be.

For Geoff Simmons and Jess Berentson-Shaw, the gender wage gap ought not be the result of the conscious choices of women making the best they can do what they have. The gender wage gap must be the result of the bad motivations of employers and other external forces. The bad motivations must be unconscious because conscious prejudice is rare these days.
The unconscious bias hypothesis suffers from the same floors as the occupational crowding and occupational segregation hypotheses. Neither the unintentional bias hypothesis nor the occupational crowding and segregation hypotheses have a filter and an equilibrating mechanism that guides employers into make unprofitable choices about hiring. These hypotheses must explain how unconsciously biased employers survive in competition with less unconsciously biased employers.
Central to Gary Becker’s theory of prejudice based discrimination is competition in the market will slowly wear down prejudice-based discrimination in the same way that it drives out any other practices inconsistent with profit maximisation and cost minimisation. Profit maximisation gets no respect in the theory of unconscious bias and the gender wage gap put forward by Geoff Simmons and Jess Berentson-Shaw.
If there are sufficient number of less unconsciously biased employers, there will be segregation. Some employers will hire a large number of women because they have the pick of the crop and will be more profitable to boot at least in the short run.
The more unconsciously biased employers will have a large number of men working for them and will be less profitable and more likely to fail. At worst, men and women will be paid to same but most women will work for these less unconsciously biased employers. The possibility of labour market segregation rather than gender wage gap was not considered in the unconscious bias hypothesis.
Unconscious bias is a preference-based explanation of the gender wage gap. The young are the last to notice the rapid social change that came before them. Cultural and preference based explanations underrate the rapid social change in the 20th century. As Gary Becker explains:
… major economic and technological changes frequently trump culture in the sense that they induce enormous changes not only in behaviour but also in beliefs. A clear illustration of this is the huge effects of technological change and economic development on behaviour and beliefs regarding many aspects of the family.
Attitudes and behaviour regarding family size, marriage and divorce, care of elderly parents, premarital sex, men and women living together and having children without being married, and gays and lesbians have all undergone profound changes during the past 50 years. Invariably, when countries with very different cultures experienced significant economic growth, women’s education increased greatly, and the number of children in a typical family plummeted from three or more to often much less than two.
Goldin (2006) showed that women adapted rapidly over the 20th century to changing returns to working and education as compared to options outside the market. Their labour force participation and occupational choices changed rapidly into long duration professional educations and more specialised training in the 1960s and 1970s as many more women worked and pursued careers. The large increase in tertiary education by New Zealand after 1990 and their move into many traditionally male occupations is another example.
The main drivers of the gender wage gap are unknown to recruiting employers such as whether a would-be recruit is married, how many children they have, whether their partner is present to share childcare, how many of children are under 12, and how many years between the births of children. Spacing out the births is a major driver of the gender pay gap but this information is unknown to employers when hiring. As Polachek explains:
The gender wage gap for never marrieds is a mere 2.8%, compared with over 20% for marrieds. The gender wage gap for young workers is less than 5%, but about 25% for 55–64-year-old men and women. If gender discrimination were the issue, one would need to explain why businesses pay single men and single women comparable salaries. The same applies to young men and young women.
One would need to explain why businesses discriminate against older women, but not against younger women. If corporations discriminate by gender, why are these employers paying any groups of men and women roughly equal pay? Why is there no discrimination against young single women, but large amounts of discrimination against older married women?
… Each type of possible discrimination is inconsistent with negligible wage differences among single and younger employees compared with the large gap among married men and women (especially those with children, and even more so for those who space children widely apart).
The main drivers of the gender wage gap are of no relevance to entrepreneurs making a profit. These findings are devastating to the notion that there is some sort of discrimination against women on the demand side of the labour market.
Employers lack the necessary information to implement any unconscious bias they might have against women in fact is mainly a bias against older women and mothers and mothers in particular the space out the births of their children. The emergence of the gender wage gap is through the supply-side choices of women because employers lack the necessary information to drive the emergence of a gender pay gap.
The career cost of a family is central to the emergence and size of the gender pay gap because it leads to self-selection on the supply-side in terms of human capital to mitigate the cost of careers breaks.
The gender gap is fairly minor before the age of 30. The female full-time employment rate drops by 10 percentage points after women enter their 30s before recovering by the time women reach the age of 50 (Johnston 2005). The gender wage gap also widens between the ages 35 to 64 when women are raising children; the biggest gap is for the ages of 44 to 44; a wage gap of 22 per cent (MWA 2010). The first child is estimated to reduce New Zealand female earnings by 7 per cent and second child reduces earnings by 10 per cent (Dixon 2000, 2001).
This self-selection of females into occupations with more durable human capital, and into more general educations and more mobile training that allows women to change jobs more often and move in and out of the workforce at less cost to earning power and skills sets. Chiswick (2006) and Becker (1985, 1993) then suggest that these supply side choices about education and careers are made against a background of a gendered division of labour and effort in the home, and in particular, in housework and the raising of children. These choices in turn reflect how individual preferences and social roles are formed and evolve in society.
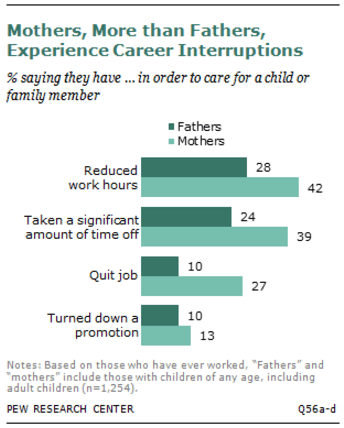
Source: On Equal Pay Day, key facts about the gender pay gap | Pew Research Center.
Tiny differences in comparative advantage such as in child rearing immediately after birth can lead to large differences in specialisation in the market work and in market-related human capital and home production related work and household human capital (Becker 1985, 1993). These specialisations are reinforced by learning by doing where large differences in market and household human capital emerge despite tiny differences at the outset (Becker 1985, 1993).
Many women choose educational and occupational paths that give them more control over their hours worked, and lowers the cost of time spent on maternity leave and the associated depreciation of skills during career breaks and reduced hours (Polachek 1978, 1981; Bertrand, Goldin and Katz 2010; Katz 2006; Sasser 2005). Women over the entire run of the 20th century often end up in jobs that reduced the career cost of a family and rapidly changed their plans when new opportunities emerge (Katz 2006).
The prospect of children drives the early choices of women on education and occupations. Careers requiring continuous commitment, long hours and great sacrifices do not attract and retain as many women (Bertrand, Goldin and Katz 2010; Goldin 2006). Goldin and Katz (2011) found that differences in the reductions on the cost of career breaks was a major driver in the influx of women into previously male dominated occupations.
The key is what drives the rapid changes in the labour force participation and occupational choices of women. Some of the factors are global technology trends such rising wages and the emergence of household technologies and safe contraception and antidiscrimination laws. All of these increased the returns to working and investing in specialised education and training.
Up until the mid-20th century, women invested in becoming a teacher, nurse, librarian or secretary because these skills were general and did not deprecate as much during breaks. When expectations among women of still working at the age of 35 doubled, there were massive increases in female labour force participation and female investments in higher education and specialised skills (Goldin and Katz 2006).
In summary, Geoff Simmons and Jess Berentson-Shaw put forward an invisible hand explanation of the residual in the gender wage gap that lacks that all-important invisible punch. There is no market mechanism which penalises employers who rise above their unconscious bias against women to hire on merit. The invisible hand rewards employers that hire on merit with higher profits and penalises those that indulge a bias of whatever origin. The invisible hand consists of an invisible finger and an invisible punch. The invisible finger points the way forward through price signals; the invisible punch slaps down those entrepreneurs whose attentions wander from their bottom line when deciding who to hire and promote.
Part two of this reply will address the particulars of the reply of Geoff Simmons and Jess Berentson-Shaw. In particular, the search and matching aspects of their explanation and whether we are all sexists.


Recent Comments