How quickly new technology was adopted by consumers, 1900-2010. Now = "almost immediately by everyone"
H/t @cdixon pic.twitter.com/RqyJgQzqQL— Paul Kirby (@paul1kirby) December 13, 2015
The gales of creative destruction are quickening
14 Dec 2015 Leave a comment
in economic history, entrepreneurship, industrial organisation, technological progress Tags: creative destruction, technology diffusion, technology diffusion lags
Labour productivity growth in New Zealand since 1951
13 Dec 2015 Leave a comment
in economic growth, economic history, macroeconomics, politics - New Zealand Tags: labour productivity, lost decades
What is creative destruction?
12 Dec 2015 Leave a comment
in economic history, entrepreneurship, industrial organisation, survivor principle, technological progress Tags: creative destruction, entrepreneurial alertness
US, British, German, French and Japanese tax revenues as % of GDP, 1965 – 2014
11 Dec 2015 Leave a comment
in economic history, politics - USA, public economics
Despite neoliberalism doing its worst, tax revenues as the percentage of GDP have been pretty stable across the G5.
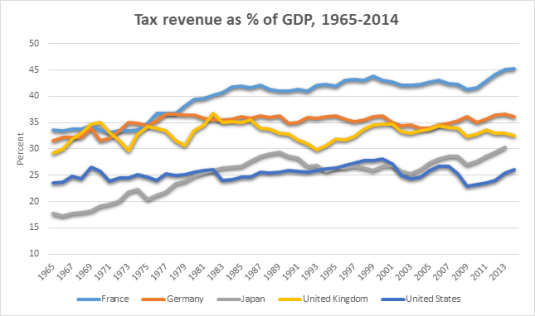
Data extracted on 11 Dec 2015 09:39 UTC (GMT) from OECD.Stat.
Nothing has happened to tax revenues as a percentage of GDP in Germany for a good 40 years. The same pretty much goes for the USA as well but with some ups and downs around the time of the GFC.
Margaret Thatcher’s time as Prime Minister coincided with the fall in tax revenue as a percentage of GDP but John Major did his best to reverse that.
French taxes have been steady since 1981 but started to increase as a percentage of GDP after the GFC. Tax revenues also increased in Japan as a percentage of GDP after the GFC.
Manufacturing as a proportion of GDP
11 Dec 2015 Leave a comment
in economic history, industrial organisation, survivor principle Tags: creative destruction, manufacturing industry
The long-term effects of vaccines
11 Dec 2015 Leave a comment
in applied welfare economics, economic history, health economics Tags: vaccines
Why didn’t @MaxRashbrooke chart the top 1%’s wealth?
10 Dec 2015 Leave a comment
in applied welfare economics, economic history, Marxist economics, politics - New Zealand Tags: top 1%, Twitter left
The latest research of Max Rashbrooke on trends in wealth was in the Dominion Post today. The breathless reporter used it to say that:
The elite and high-income earners of New Zealand have increased their wealth by almost $200 billion while debt among the poorest has climbed to $7b…
The net wealth of the top 10 per cent has increased dramatically while the bottom 10 per cent of Kiwis face increasing levels of debt in the billions of dollar…
The data in the Dominion Post today consisted of a time series of the top 10% and the bottom 10% share of net wealth and an interactive pie chart showing the distribution of wealth.
When you chart the data published by Max Rashbrooke as a time series rather than an interactive pie chart, today is not quite the day for the down-trodden proletariat to kick in the rotten door of neoliberal capitalism to start the permanent revolution.

It is not much of a call to the barricades to say that just about every section of New Zealand society became much richer in a short six-year period – their wealth increased by between 60-80% between 2004 and 2010 as shown in the chart below. The middle class has been doing just swimmingly between 2004 and 2010: up from $194 billion to $348 billion in a short six years. This is an increase of 80% in six years. So rapid an increase that the sceptics among you might start to doubt the accuracy of the data either at the beginning or by the end.
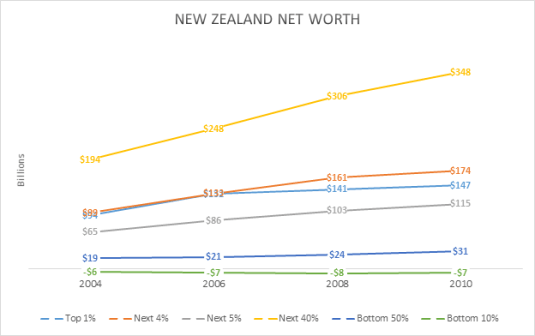
Furthermore, no section of society noticeably increased their share of wealth as shown in the chart below. Further evidence of how lazy is the top 1% is in New Zealand. Their wealth increased only by 56% between 2004 and 2010. Having the wealth of the top 1% increase by less than every group in society bar the bottom 10% qualifies as a dramatic increase in inequality by the journalistic standards of the Dominion Post. The wealth of the top 10% increased between 2004 and 2010 by 68% – no more than any other group in society bar the top bottom 10%. That too is a dramatic increase in inequality by Dominion Post standards.
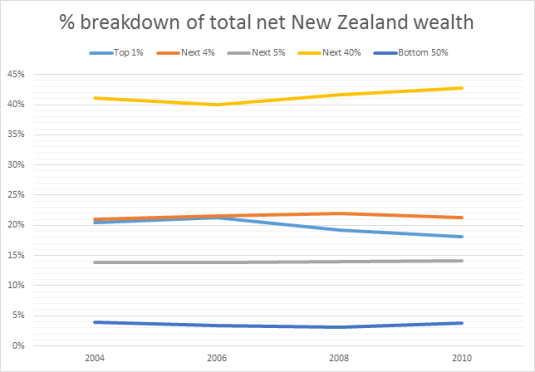
Source: Geoff Rashbrooke, Max Rashbrooke and Wilma Molano, Wealth Disparities in NZ Institute for Governance and Policy Studies (November 2015) via The richest 10 per cent own $436 billion of New Zealand’s wealth: research | Stuff.co.nz.
Joan Robinson in the 1940s was on to this failure of capitalism to impoverish the proletarian when she said the battle cry of Marxists would have to change from the 1848 version “rise up ye workers, rise up for you have nothing to lose but your chains” to “rise up ye workers, rise up for you have nothing to lose but the prospect of a suburban home and a motorcar”.

Today that battle cry of the Marxist revolution would have to be “rise up ye workers rise up for you have nothing to lose but your iPhone and your air points”. As Joan Robinson observed in the 1940s, that’s not much of a basis for a revolutionary movement.
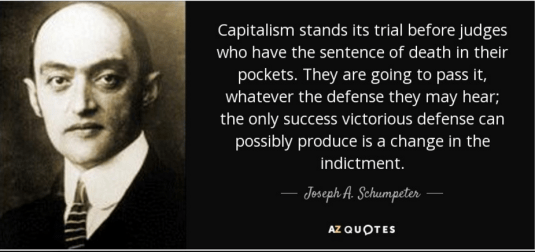
The Twitter Left are grumpy buggers because a rapid increase in wealth that is broad-based across New Zealand society – lifting up 90% of New Zealand society – for them is only another reason to complain.


The coalition of obsolete industries needs your support
10 Dec 2015 Leave a comment
in applied price theory, economic history, entrepreneurship, industrial organisation, survivor principle
The minimum wage increases the gender wage gap at the bottom
09 Dec 2015 1 Comment
in applied price theory, discrimination, economic history, gender, minimum wage, politics - New Zealand, politics - USA
Geoff Simmons is one of many to argue that the gender wage gap is smaller at the bottom end of the labour market because of the minimum wage. For example, the explanation of the Economic Policy Institute for greater gender pay equality at the bottom is the minimum wage:
The minimum wage is partially responsible for this greater equality among the lowest earners—it sets a wage floor that applies to everyone, which means that people near the bottom of the distribution are likely to make more equal wages. Also, low-wage workers are disproportionately women, which means that the minimum wage particularly bolsters women’s wages.
This is plainly wrong as a question of economic theory and political history. One effect of minimum wages is it lowers the cost of discrimination against the employment of less-preferred workers. Since the employer has to pay the minimum wage hour no matter whom he hires, the cost of discriminating on the basis of sex or race is less.
That is why South African whites at the beginning of and all through the apartheid era demanded that blacks be paid the minimum wage: they wanted to cheapen the cost of discrimination.
Minimum wages were initially introduced in the USA shortly after 1900 solely for women and children. The express aim was to price women out of jobs and raise men’s wages by enough so that they could provide for their families.
Tim Leonard in Protecting Family and Race The Progressive Case for Regulating Women’s Work showed that these women-only minimum wages were justified by political progressive including women on grounds that they would:
(1) Protect the biologically weaker sex from the hazards of market work;
(2) Protect working women from the temptation of prostitution;
(3) Protect male heads of household from the economic competition of women; and
(4) Ensure that women could better carry out their eugenic duties as “mothers of the race.”
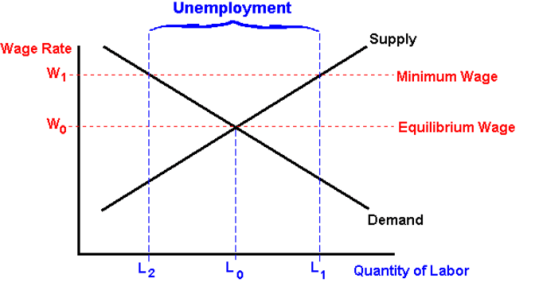
These days some argue that minimum wages actually increase employment. Times change, and the slopes of supply and demand curves for labour must change with them.
If there is a minimum wage, the cost to employers of indulging their conscious prejudices or an unconscious bias are less. This is because a minimum wage set above the market clearing wage will cause unemployment. Because jobs must be rationed, the costs of indulging a prejudice or succumbing to an unconscious bias are reduced and along with that the market mechanisms that wear down discrimination by employers.
Part of the explanation of the gender wage gap is interruptions in labour force participation because of motherhood reduces the time available to them for job shopping. The first 10 to 15 years of most careers, most working lives, is spent job shopping.
Job shopping is where wages grow through the accumulation of search capital. By moving between 6 to 10 jobs in their first 10 to 15 years in the workforce, a worker finds better and better matches for their skills and talents. They worked their way into the better paying job simply because they have had more time to find a good job match between the changing array of vacancies and their idiosyncratic set of skills and work history.
Great quote on the cruelty of the minimum wage from Nobel economist Vernon Smith, illustrated by Henry Payne https://t.co/Lwch51acEY—
Mark J. Perry (@Mark_J_Perry) October 24, 2015
The minimum wage frustrates this job shopping by denying some women their initial stepping stone into the labour market both when they are a teenager and when they are returning from time spent caring for children. This is in addition to the minimum wage increasing the gender wage gap from reducing the costs of discrimination to employers.
The minimum wage reduces women’s opportunities to get a foothold in the labour market and build on that foothold through job shopping.
Corruption vs. Human Development
09 Dec 2015 Leave a comment
in development economics, economic history, economics of bureaucracy, economics of crime, economics of regulation, growth disasters, growth miracles, income redistribution, industrial organisation, law and economics, Public Choice, rentseeking Tags: bribery and corruption, capitalism and freedom, rent seeking, rule of law, The Great Fact
Corruption vs. Human Development (HDI) http://t.co/WNlSMYzdWD—
Max Roser (@MaxCRoser) August 08, 2015
More on The Great Enrichment
09 Dec 2015 Leave a comment
in applied welfare economics, development economics, economic history, growth disasters, growth miracles Tags: The Great Enrichment, The Great Escape, The Great Fact
Crime has been trending downwards for 20 years in New Zealand
09 Dec 2015 Leave a comment
in economic history, economics of crime, law and economics, politics - New Zealand Tags: crime and punishment, law and order
Voter turnout in New Zealand
08 Dec 2015 Leave a comment
in economic history, politics - New Zealand, Public Choice Tags: voter turnout


Recent Comments