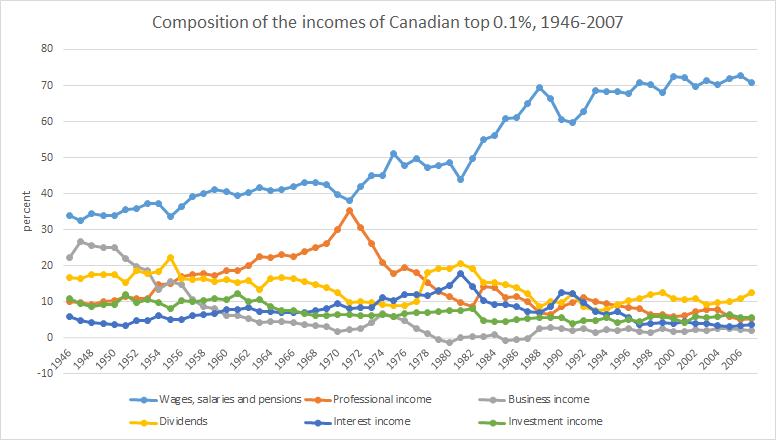
Source: The World Wealth and Income Database.
Celebrating humanity's flourishing through the spread of capitalism and the rule of law
09 Jan 2016 Leave a comment
in applied welfare economics, economic history, human capital, labour economics, poverty and inequality Tags: Canada, superstars, superstore wages, top 0.1%, top incomes
Source: The World Wealth and Income Database.
09 Jan 2016 Leave a comment
in applied welfare economics, economic history, human capital, labour economics, politics - New Zealand, poverty and inequality Tags: Leftover Left, superstar wages, superstars, top incomes
Apart from a bump in the late 80s, the top income earners in New Zealand really are not doing much better than they were in the 1950s or 1920s. The rich are not getting richer in New Zealand. They are just holding their own.
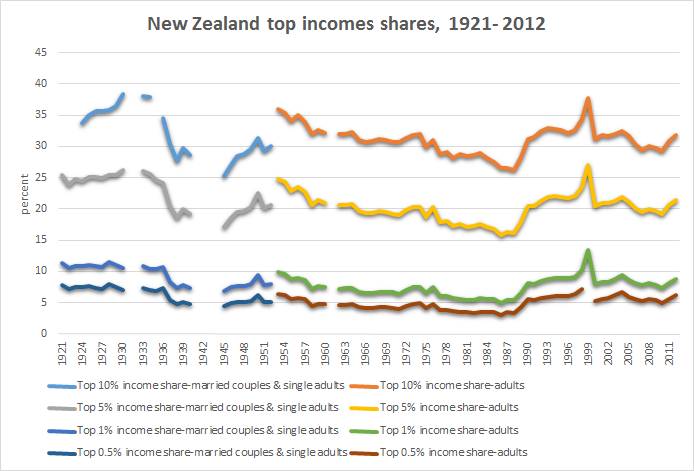
Source: The World Wealth and Income Database.
09 Jan 2016 Leave a comment
in economic history, health economics, politics - USA Tags: 2016 presidential election, Health spending
https://twitter.com/PolitiFact/status/678444166016335872/photo/1
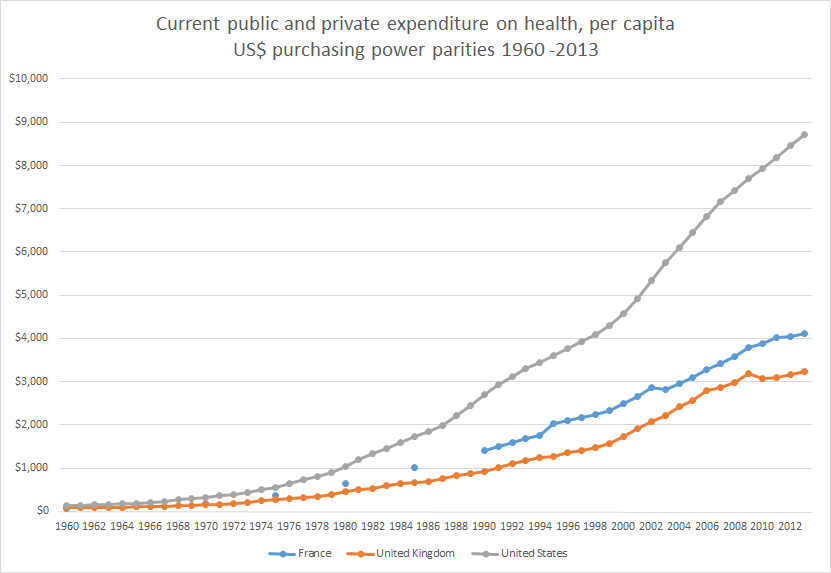
Source: OECD Health Statistics 2015.
09 Jan 2016 2 Comments
in discrimination, economic history, politics - USA
The heat maps showing the density of the listings, first in 1947 and then in 1956 in the Green Book.

Source: The forgotten way African Americans stayed safe in a racist America – The Washington Post.
According to the Washington Post article today:
in 1936, a postal worker named Victor Green began publishing a guide to help African American travellers find friendly restaurants, auto shops and accommodations in far-off places. Green dubbed the guide after himself – the “Green Book” – and published it for decades. Green says he was inspired by the Jewish press, which had long published information on restricted places…
The Green Book included listings for hotels, restaurants, gas stations, bars and beauty salons across the U.S., as well as travel articles, paid advertisements, and stories about local attractions.
The rise of car ownership among the black middle class made it more and more costly for businesses to turn away their trade despite threats of local lawlessness sanctioned by the police and local and state governments.
08 Jan 2016 Leave a comment
in applied welfare economics, economic history, human capital, labour economics, poverty and inequality Tags: Canada, superstar wages, superstars, top 1%, working rich
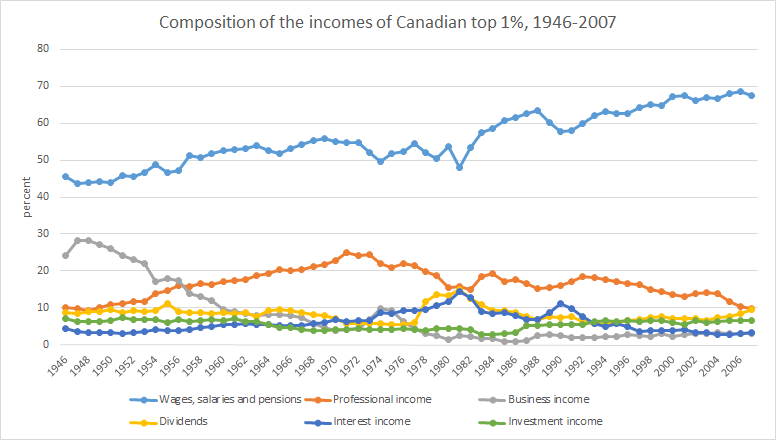
Source: The World Wealth and Income Database.
08 Jan 2016 Leave a comment
in economic history, human capital, labour economics, politics - Australia, poverty and inequality Tags: Australia, superstar wages, superstars, top incomes, working rich
Over the course of the post-war period top incomes in Australia turned into top wage earners. It is unfortunate that information is not available on the extent to which business incomes make up the balance of top incomes as distinct from dividend incomes.
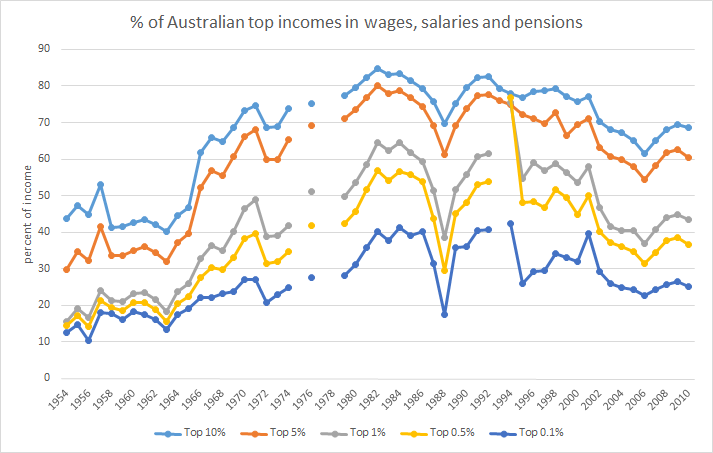
Source: The World Wealth and Income Database.
08 Jan 2016 2 Comments
in applied price theory, economic history, politics - Australia, politics - New Zealand, politics - USA, poverty and inequality Tags: Australia, Leftover Left, top 1%
What slackers. Despite 30 years of neoliberalism oppressing the unions and working class, the top 1% in New Zealand (and Australia) are unable to do any better in terms of their share of national income than in the good old days of pre-1984 New Zealand looked upon with such fondness by the the Leftover Left.

Source: The World Wealth and Income Database.
08 Jan 2016 Leave a comment
in economic history, labour economics, politics - New Zealand, poverty and inequality Tags: child poverty, family poverty, Leftover Left, living standards, Maori economic development, Twitter left
https://twitter.com/sbancel/status/654162844884205568
Pakeha and Pasifika real household incomes increased by 55% since the low point of 1994. Maori household incomes increased by 65% since 1994.
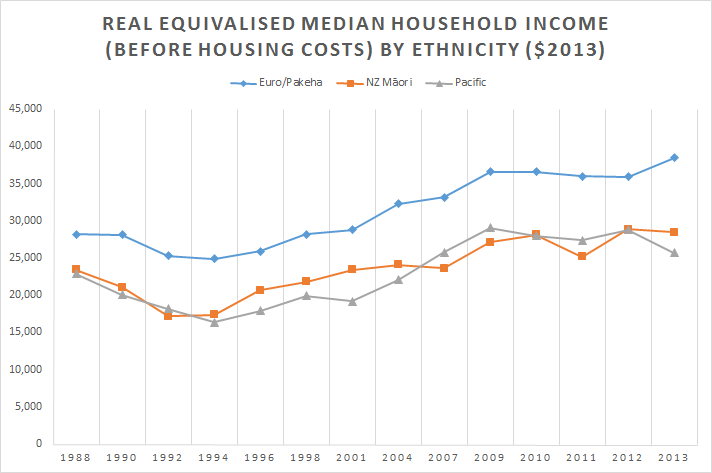
Source: Bryan Perry, Household Incomes in New Zealand: trends in indicators of inequality and hardship 1982 to 2014 – Ministry of Social Development, Wellington (August 2015), Table D.6.
08 Jan 2016 Leave a comment
in economic history, health economics, politics - USA Tags: 2016 presidential election, British economy, France, Health spending
https://twitter.com/PolitiFact/status/678444166016335872

Source: World Bank Health expenditure per capita, PPP (constant 2011 international$) | Data | Table.
07 Jan 2016 Leave a comment
in economic history Tags: sociology of science
05 Jan 2016 Leave a comment
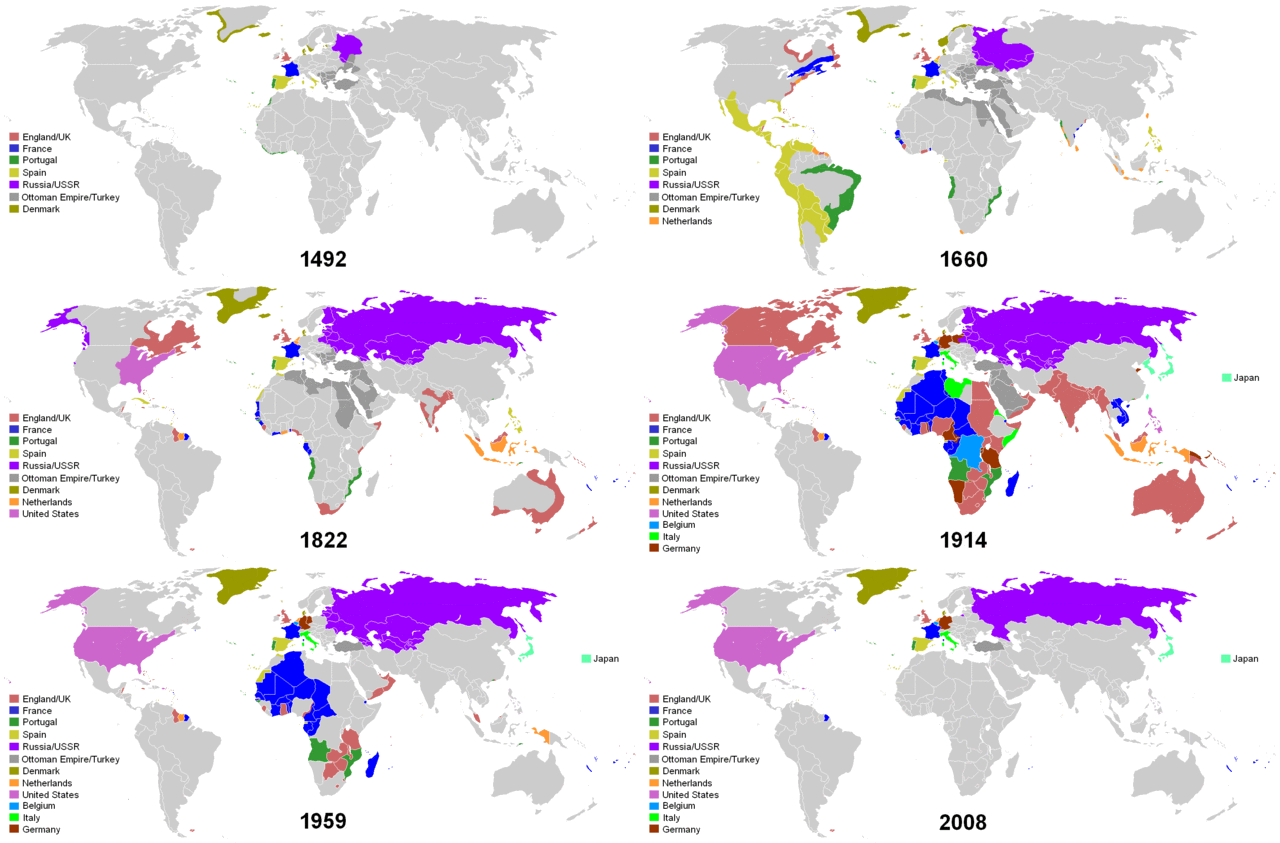
in economic history Tags: age of empires, maps
04 Jan 2016 Leave a comment
in economic history, politics - New Zealand, public economics
Oddly enough, the lost decades of New Zealand growth coincide with the rapid growth in the size of government between 1974 and 1992. The return of growth to New Zealand from 1992 after 17 years of stagnation and next to no real GDP growth coincided with the decline in the size of government.
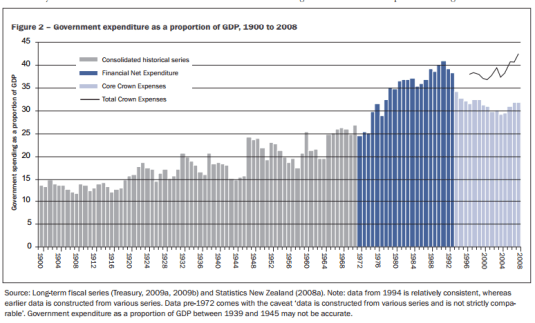
Source: David Rea 2009.
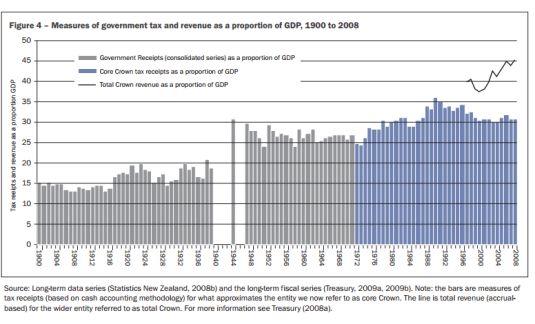
Source: David Rea 2009.
04 Jan 2016 Leave a comment
in economic history, politics - New Zealand
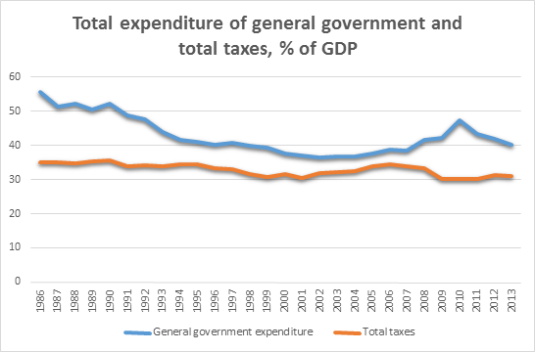
Source: Data extracted on 04 Jan 2016 06:49 UTC (GMT) and 07:01 UTC (GMT) from OECD.Stat
The OECD calculations using general government expenditure lead to an estimate of the size of government in New Zealand that is at least 10 percentage points larger at times than when using core crown expenses or total taxes as a percentage of GDP. I once asked the Treasury why was this was so as they had plotted both core crown expenses and general government expenditures as a percentage of GDP in a chart. They did not know why.
Celebrating humanity's flourishing through the spread of capitalism and the rule of law
Celebrating humanity's flourishing through the spread of capitalism and the rule of law
Celebrating humanity's flourishing through the spread of capitalism and the rule of law
Celebrating humanity's flourishing through the spread of capitalism and the rule of law
Celebrating humanity's flourishing through the spread of capitalism and the rule of law
Celebrating humanity's flourishing through the spread of capitalism and the rule of law
Celebrating humanity's flourishing through the spread of capitalism and the rule of law
Celebrating humanity's flourishing through the spread of capitalism and the rule of law
Celebrating humanity's flourishing through the spread of capitalism and the rule of law
Celebrating humanity's flourishing through the spread of capitalism and the rule of law
Celebrating humanity's flourishing through the spread of capitalism and the rule of law
Celebrating humanity's flourishing through the spread of capitalism and the rule of law
A History of the Alt-Right
Econ Prof at George Mason University, Economic Historian, Québécois
Celebrating humanity's flourishing through the spread of capitalism and the rule of law
Scholarly commentary on law, economics, and more
Beatrice Cherrier's blog
Celebrating humanity's flourishing through the spread of capitalism and the rule of law
Celebrating humanity's flourishing through the spread of capitalism and the rule of law
Celebrating humanity's flourishing through the spread of capitalism and the rule of law
Why Evolution is True is a blog written by Jerry Coyne, centered on evolution and biology but also dealing with diverse topics like politics, culture, and cats.
Celebrating humanity's flourishing through the spread of capitalism and the rule of law
A rural perspective with a blue tint by Ele Ludemann
DPF's Kiwiblog - Fomenting Happy Mischief since 2003
Celebrating humanity's flourishing through the spread of capitalism and the rule of law
The world's most viewed site on global warming and climate change
Tim Harding's writings on rationality, informal logic and skepticism
A window into Doc Freiberger's library
Let's examine hard decisions!
Commentary on monetary policy in the spirit of R. G. Hawtrey
Thoughts on public policy and the media
Celebrating humanity's flourishing through the spread of capitalism and the rule of law
Politics and the economy
A blog (primarily) on Canadian and Commonwealth political history and institutions
Reading between the lines, and underneath the hype.
Economics, and such stuff as dreams are made on
"The British constitution has always been puzzling, and always will be." --Queen Elizabeth II
Celebrating humanity's flourishing through the spread of capitalism and the rule of law
Celebrating humanity's flourishing through the spread of capitalism and the rule of law
WORLD WAR II, MUSIC, HISTORY, HOLOCAUST
Undisciplined scholar, recovering academic
Celebrating humanity's flourishing through the spread of capitalism and the rule of law
Res ipsa loquitur - The thing itself speaks
In Hume’s spirit, I will attempt to serve as an ambassador from my world of economics, and help in “finding topics of conversation fit for the entertainment of rational creatures.”
Researching the House of Commons, 1832-1868
Reflections on books and art


Recent Comments