Of the 15 inheritance based billionaires, three are from the Walton family, two are the Koch brothers and another three are from the Mars family.

Source: The world’s top 50 billionaires: A demographic breakdown.
Celebrating humanity's flourishing through the spread of capitalism and the rule of law
01 Jun 2016 Leave a comment
in applied price theory, applied welfare economics, economic history, entrepreneurship, financial economics, human capital, labour economics, poverty and inequality, unions Tags: entrepreneurial alertness, inherited wealth, superstar wages, superstars, top 0.1%, top 1%
Of the 15 inheritance based billionaires, three are from the Walton family, two are the Koch brothers and another three are from the Mars family.
Source: The world’s top 50 billionaires: A demographic breakdown.
26 Mar 2016 Leave a comment
in applied welfare economics, economic history, entrepreneurship, human capital, labour economics, poverty and inequality Tags: entrepreneurial alertness, superstar wages, superstars, top 0.1%, top 1%
Piketty and Saez (2003, updated) estimated the share of income held by the top 1% from 13 percent in 1991 to 23 percent in 2012. The new Bricker et al. research shows only a 7 percentage point increase to 18 percent in 2012. The share held by the super-rich, the top 0.1% has increased much at all.

Source: Measuring income and wealth at the top using administrative and survey data via How super-rich Americans get that way is changing – AEI | Pethokoukis Blog » AEIdeas.

Source: Measuring income and wealth at the top using administrative and survey data via How super-rich Americans get that way is changing – AEI | Pethokoukis Blog » AEIdeas.
09 Jan 2016 Leave a comment
in applied welfare economics, economic history, human capital, labour economics, poverty and inequality Tags: Canada, superstars, superstore wages, top 0.1%, top incomes

Source: The World Wealth and Income Database.
02 Oct 2015 2 Comments
in entrepreneurship, human capital, industrial organisation, labour supply, occupational choice, politics - USA, poverty and inequality Tags: entrepreneurial alertness, superstar wages, superstars, top 0.01%, top 0.1%, top 1%, working rich
The IMF has joined the OECD in arguing there is an important connection between inequality and who gains from economic growth.
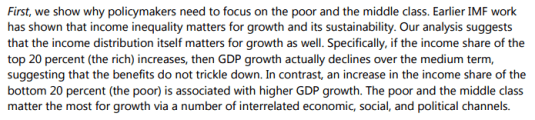
To reach the conclusion that the income distribution matters, the IMF had to tie its master the exact same weak moorings that the OECD did. Specifically the ability of the lower middle class to finance investments in school and higher education.
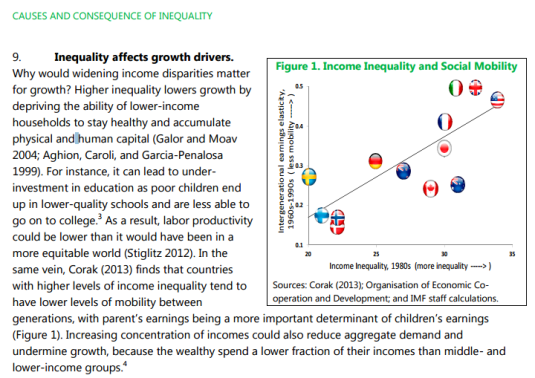
The IMF has articulated a specific hypothesis that can be confronted with facts and logic.
Many critics of inequality are extremely vague about what exactly is the process that grinds the proletariat down. The withering away of the proletariat in the 20th century has been discussed elsewhere on this blog.
The impact of low income on the ability to accumulate physical and human capital sounds like an interesting question. Not surprisingly, the top labour economists have looked into it.
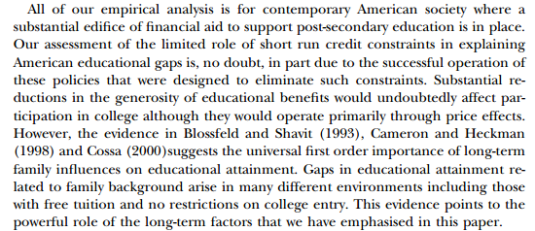
Short-term factors such as the ability to borrow to fund higher education has been found to be seriously wanting. Only a small percentage of people are in any way constrained from going on to higher education because of the lack of money. This is not surprising in any society with student loans freely available at low or zero rates without any need to post collateral.
Wow. I mean, WOW. College completion figures over time by income quartile. bit.ly/16Bb1jh http://t.co/y0MVyiDCEZ—
Richard V. Reeves (@RichardvReeves) February 04, 2015
The notion that the rich are just replicating the good fortunes of their parents has also fallen on hard times despite the persistence of the OECD and the IMF in championing this old Marxist fantasy.
Source: The World Top Incomes Database.
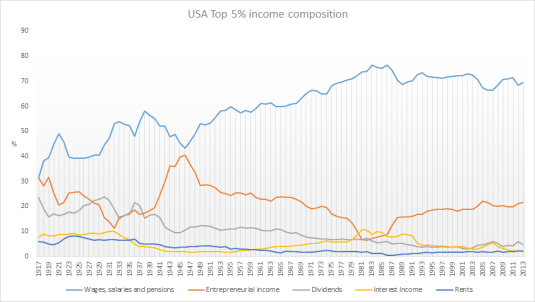
If you look at the income composition of the top 5% of the USA, for example, it is a disappointing story for the IMF and the OECD. Today’s rich are working rich with the majority of their income from wages and salaries and much of the rest from entrepreneurial income. There is no passive rich earning incomes from their inherited investments and grinding the proletariat down.
Source: The World Top Incomes Database.
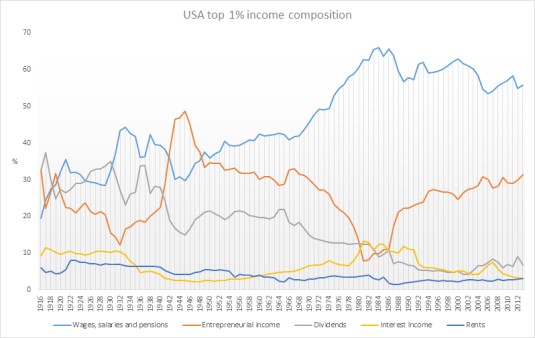
It is the same story with the top 1%. They are working rich with the majority of their incomes paid in wages and salaries and running a business. They are top executives, managers and leading professionals that go to work every day.
Who are today’s supermanagers and why are they so wealthy? equitablegrowth.org/research/today… http://t.co/Ts2OkOUk5g—
Equitable Growth (@equitablegrowth) December 03, 2014
The IMF was simply wrong to claim that at least half the income of the top 1% in the USA was not labour income.
Before 1940, most of the income of the top 0.1% of income earners in the USA was income from investments. By the end of the 20th century, the top 0.1% were earning their incomes as wages and salaries, business incomes and capital gains. Very little of that income of the top 0.1% was in the form of passive income from capital. The top 0.1% of the USA are now working rich – entrepreneurs.
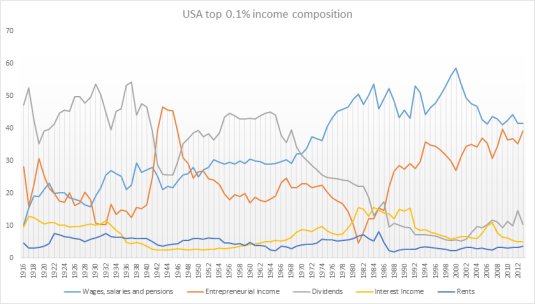
Source: The World Top Incomes Database.
In the good old days of high taxes, the top 0.01% did earn the great majority of their income from passive investment.
Only under the scourge of neoliberalism starting in the 1970s and then massive tax cuts in the Reagan Revolution did the top 0.01% join the working rich. Even the super super-rich have to work for their money these days.
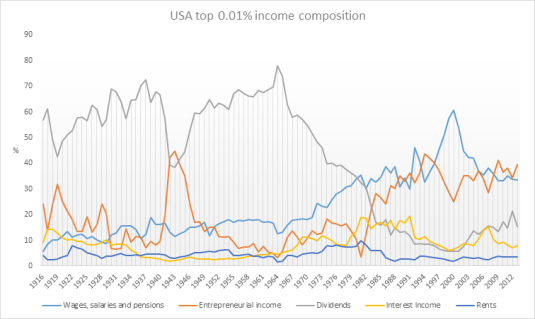
Source: The World Top Incomes Database.
The IMF and before it the OECD were batting from a weak position when they argued that human capital investments of ordinary families is held up by inequality. Student loans to pay for subsidised tuition fees and living expenses solve that problem long ago.
How many of the richest Americans inherited their fortune? Find out. buff.ly/1DNM3g2 http://t.co/QlarE5yAdT—
HumanProgress.org (@humanprogress) August 14, 2015
It was simply wrong of the IMF to claim that the top 5%, 1% and 0.1% of for example the USA are living off the rest of society. In the USA, is usually put forward as the worst-case, the rich and super-rich are working rich making their fortunes by building and running businesses. In The Evolution of Top Incomes: A Historical and International Perspective (NBER Working Paper No. 11955), Thomas Piketty and Emmanuel Saez concluded that:
While top income shares have remained fairly stable in Continental European countries or Japan over the past three decades, they have increased enormously in the United States and other English speaking countries. This rise in top income shares is not due to the revival of top capital incomes, but rather to the very large increases in top wages (especially top executive compensation). As a consequence, top executives (the “working rich”) have replaced top capital owners at the top of the income hierarchy over the course of the twentieth century…
Steven Kaplan and Joshua Rauh make a number of basic points backed up by detailed evidence about top CEO pay:
The report SuperEntrepreneurs shows that:
John Rawls is often put forward by political progressives as the starting point for political philosophy. Rawls pointed out that behind the veil of ignorance, people will agree to inequality as long as it is to everyone’s advantage. Rawls was attuned to the importance of incentives in a just and prosperous society. If unequal incomes are allowed, this might turn out to be to the advantage of everyone.
Steven Kaplan and Joshua Rauh’s “It’s the Market: The Broad-Based Rise in the Return to Top Talent”, Journal of Economic Perspectives (2013) found that:
Today’s super-rich are highly productive because they produce new and better products and services that people want and are willing to pay for. These rewards for entrepreneurship and hard work guide people of different talents and skills into the occupations and industries where their talents are valued the most. The efficient allocation of talent and income maximising occupational choices were important to Rawls’ framework.
The IMF and World Bank should look for policies that remove barriers to riches. Instead, the IMF and OECD are giving support to those who want to tax and regulate the super-rich that drive much of the innovation, entrepreneurship and creative destruction in modern economies.
24 Aug 2015 Leave a comment
in economic history, entrepreneurship, financial economics Tags: creative destruction, entrepreneurial alertness, top 0.01%, top 0.1%, top 1%
Average Income for the top 0.01% since 1913 bit.ly/1wZhZHE #inequality http://t.co/a6w7xo2Kqq—
Catherine Mulbrandon (@VisualEcon) November 03, 2014
22 Aug 2015 Leave a comment
in applied price theory, applied welfare economics, economics of bureaucracy, economics of regulation, financial economics, income redistribution, industrial organisation, politics - Australia, politics - New Zealand, politics - USA, Public Choice, rentseeking, survivor principle Tags: Australia, billionaires, Russia, top 0.1%, top 1%

…Bagchi and Svejnar carefully went through the lists of all the Forbes billionaires, and divided them into those who had acquired their wealth due to political connections, and those who had not. This is kind of a slippery slope — almost all billionaires have probably benefited from government connections at one time or another.
But the researchers used a very conservative standard for classifying people as politically connected, only assigning billionaires to this group when it was clear that their wealth was a product of government connections. Just benefiting from a government that was pro-business, like those in Singapore and Hong Kong, wasn’t enough.
Rather, the researchers were looking for a situation like Indonesia under Suharto, where political connections were usually needed to secure import licenses, or Russia in the mid-1990s, when some state employees made fortunes overnight as the state privatized assets.
…The negative effects of wealth inequality are largely being driven by politically connected wealth inequality. That seems to be the primary channel that drives this relationship…
a 3.72 percent increase in the level of wealth inequality would cost a country about half a percent of real GDP per capita growth. That’s a big impact, given that average GDP growth is in the neighbourhood of two percent per year
20 Aug 2015 Leave a comment
in applied price theory, human capital, income redistribution, labour economics, labour supply, politics - USA, poverty and inequality, Public Choice, rentseeking, sports economics Tags: expressive voting, Left-wing hypocrisy, Leftover Left, mass kidnappings, Occupy Wall Street, rational ignorance, rational irrationality, superstar wages, superstars, top 0.1%, top 1%
Ratio of Median Salary of Top 25 Highest Paid MLB Player to Avg. Worker Pay Increased from 100:1 to 700:1 Since 1988 http://t.co/5zLktBXS3D—
Mark J. Perry (@Mark_J_Perry) August 18, 2015
15 Aug 2015 Leave a comment
in applied price theory, applied welfare economics, economic history, entrepreneurship, industrial organisation, survivor principle Tags: antimarket bias, entrepreneurial alertness, superstar wages, superstars, top 0.1%, top 1%, top wage earners
How many of the richest Americans inherited their fortune? Find out. buff.ly/1DNM3g2 http://t.co/QlarE5yAdT—
HumanProgress.org (@humanprogress) August 14, 2015
29 Jul 2015 Leave a comment
in sports economics Tags: CEO pay, Occupy Wall Street, superstar wages, superstars, top 0.1%, top 1%
Rising incomes in sports: Top salaries in baseball & basketball are higher than in football
bit.ly/1DEfFtc http://t.co/DUyJld5iah—
Max Roser (@MaxCRoser) July 21, 2015
The rising incomes of major league baseball players since 1890
Part of the inequality story in the USBy @VisualEcon http://t.co/m5GgaKGwSv—
Max Roser (@MaxCRoser) July 19, 2015
29 Jul 2015 Leave a comment
in applied price theory, applied welfare economics, entrepreneurship, financial economics, human capital, labour economics, occupational choice Tags: CEO pay, compensating differentials, entrepreneurial alertness, top 0.1%, top 1%, top income earners, top wage earners
Page 41 from "An Illustrated Guide to Income" more economic #dataviz at: bit.ly/11v2e9k http://t.co/7Hlgk4AjZn—
Catherine Mulbrandon (@VisualEcon) May 22, 2013
20 Jul 2015 Leave a comment
The top 0.000003% in the US
by @VisualEcon http://t.co/eHmUrWzp6X—
Max Roser (@MaxCRoser) July 16, 2015
26 Jun 2015 Leave a comment
in economic history, entrepreneurship, human capital, labour economics, labour supply, Marxist economics, occupational choice, politics - Australia, politics - USA, poverty and inequality Tags: Australia, British economy, Canada, Leftover Left, top 0.1%, top 1%
Figure 1: top 0.1% share of gross income, Australia, UK, USA and Canada since 1946

Source: Chartbook of Economic Inequality.
The top 0.1% in Australia is earning not much more than it did in 1946. For most of the post-war period, the Australian top 0.1% earned less than what it earned in 1946. The only spike in the earnings of the Australian top 0.1% occurred after the top tax rate of 66% was reduced to 49% in 1986.
There were major cuts in the top tax rates in Australia,the USA and UK in the early 1980s. Figure 1 shows that these top tax rate cuts were matched with a spike in the earnings of the top 0.1% subsequent to those large tax cuts.
05 Jun 2015 Leave a comment
in labour economics, sports economics Tags: baseball, superstar wages, superstars, top 0.1%, top 1%
Why Baseball Players Are Actually Underpaid theatlantic.com/business/archi… | http://t.co/qBgcmxLWca—
Charts and Maps (@ChartsandMaps) April 04, 2015
Major league baseball salary growth is slowing http://t.co/Jw6gYG1ylQ—
Charts and Maps (@ChartsandMaps) April 04, 2015
Baseball salaries hit a record high http://t.co/AfvlMEVHbf—
Charts and Maps (@ChartsandMaps) April 12, 2015
03 Jun 2015 Leave a comment
in economic history, entrepreneurship, financial economics, human capital, industrial organisation, labour economics, labour supply, occupational choice, survivor principle Tags: CEO pay, entrepreneurial alertness, Occupy Wall Street, separation of ownership and control, superstar wages, superstars, top 0.1%, top 1%, Twitter left
The members of the top 1% whose income increased the most between 1979 and 2005 were real estate professionals followed by financial professionals – see figure 1.
Figure 1: increase in share of national income (including capital gains) received by top 1% for each primary taxpayer occupation in top 1% between 1979 and 2005

Source: Jon Bakija, Adam Cole and Bradley T. Heim “Jobs and Income Growth of Top Earners and the Causes of Changing Income Inequality: Evidence from U.S. Tax Return Data”.
Figure 2 shows that the fastest-growing shares among the top 1% as in figure 1 are not necessarily the largest occupational group are those income earners. Moreover, their fortunes seem largely unrelated to each other.
Figure 2: Percentage of national income (including capital gains) received by top 1%, and each primary taxpayer occupation in top 1%

Source: Jon Bakija, Adam Cole and Bradley T. Heim “Jobs and Income Growth of Top Earners and the Causes of Changing Income Inequality: Evidence from U.S. Tax Return Data”.
The next members of the top 1% in terms of income growth were rather respectable group:professionals and scientists and arts, media and sports. The latter,arts, media and sports get a complete pass on their membership of the top 1% despite their great success in increasing their incomes since 1979 at the expense apparently on the bottom 99% if the Twitter Left is to be believed.
Figure 3: increase in share of national income (including capital gains) received by top 0.1% for each primary taxpayer occupation in top 0.1%between 1979 and 2005

Source: Jon Bakija, Adam Cole and Bradley T. Heim “Jobs and Income Growth of Top Earners and the Causes of Changing Income Inequality: Evidence from U.S. Tax Return Data”.
Arts, media and sports superstars are one of the fastest-growing members of the top 0.1% – see figure 3. Again, the arts, media and sports superstars get a complete pass on their membership of the top 0.1% from the Twitter Left. Most of the other occupations in the top 0.1% don’t strike me as anything other than working rich – see figure 3 and figure 4.
As with the top 1%, the top 0.1% of income earners are a mixed bag of occupations – see figure 4. Their fortunes are unrelated to each other terms of the forces driving there are increased incomes.
Figure 4: Percentage of national income (including capital gains) received by top 0.1%, and each primary taxpayer occupation in top 0.1%

Source: Jon Bakija, Adam Cole and Bradley T. Heim “Jobs and Income Growth of Top Earners and the Causes of Changing Income Inequality: Evidence from U.S. Tax Return Data”.
01 Jun 2015 Leave a comment
in economic history, entrepreneurship, human capital, industrial organisation, labour economics, labour supply, occupational choice, survivor principle Tags: Canada, CEO pay, creative destruction, entrepreneurial alertness, super-entrepreneurs, superstar wages, superstars, top 0.1%, top 1%, working rich
Piketty and Saez (2003) concluded that a substantial fraction of the rise in top incomes was due to surging top wage incomes. They concluded that top executives (the ‘working rich’) replaced top capital owners (the ‘rentiers’) at the top of the income hierarchy.
That conclusion still holds for both the USA and Canada. The largest portion of the top 0.1% in both countries have become those earning wages. The top 0.1% are top wage earners who work for their livings founding, building or directing businesses.
Figure 1: percentage of top 0.1% with wages, salaries, pensions or entrepreneurial incomes, USA, 1916 – 2013

Source: Alvaredo, Facundo, Anthony B. Atkinson, Thomas Piketty and Emmanuel Saez, The World Top Incomes Database.
Figure 2: percentage of top 0.1% with incomes from interest, dividends and rents, USA, 1916 – 2013

Source: Alvaredo, Facundo, Anthony B. Atkinson, Thomas Piketty and Emmanuel Saez, The World Top Incomes Database.
Figure 3: percentage of top 0.1% with wage salary and pension incomes, business incomes and professional incomes, Canada, 1946 – 2007

source : Alvaredo, Facundo, Anthony B. Atkinson, Thomas Piketty and Emmanuel Saez, The World Top Incomes Database.
Figure 4: percentage of top 0.1% with dividend, interest or investment incomes, Canada, 1946 – 2007

Source: Alvaredo, Facundo, Anthony B. Atkinson, Thomas Piketty and Emmanuel Saez, The World Top Incomes Database.
Celebrating humanity's flourishing through the spread of capitalism and the rule of law
A History of the Alt-Right
Econ Prof at George Mason University, Economic Historian, Québécois
Celebrating humanity's flourishing through the spread of capitalism and the rule of law
Scholarly commentary on law, economics, and more
Beatrice Cherrier's blog
Celebrating humanity's flourishing through the spread of capitalism and the rule of law
Celebrating humanity's flourishing through the spread of capitalism and the rule of law
Celebrating humanity's flourishing through the spread of capitalism and the rule of law
Why Evolution is True is a blog written by Jerry Coyne, centered on evolution and biology but also dealing with diverse topics like politics, culture, and cats.
Celebrating humanity's flourishing through the spread of capitalism and the rule of law
A rural perspective with a blue tint by Ele Ludemann
DPF's Kiwiblog - Fomenting Happy Mischief since 2003
Celebrating humanity's flourishing through the spread of capitalism and the rule of law
The world's most viewed site on global warming and climate change
Tim Harding's writings on rationality, informal logic and skepticism
A window into Doc Freiberger's library
Let's examine hard decisions!
Commentary on monetary policy in the spirit of R. G. Hawtrey
Thoughts on public policy and the media
Celebrating humanity's flourishing through the spread of capitalism and the rule of law
Politics and the economy
A blog (primarily) on Canadian and Commonwealth political history and institutions
Reading between the lines, and underneath the hype.
Economics, and such stuff as dreams are made on
"The British constitution has always been puzzling, and always will be." --Queen Elizabeth II
Celebrating humanity's flourishing through the spread of capitalism and the rule of law
Celebrating humanity's flourishing through the spread of capitalism and the rule of law
WORLD WAR II, MUSIC, HISTORY, HOLOCAUST
Undisciplined scholar, recovering academic
Celebrating humanity's flourishing through the spread of capitalism and the rule of law
Res ipsa loquitur - The thing itself speaks
In Hume’s spirit, I will attempt to serve as an ambassador from my world of economics, and help in “finding topics of conversation fit for the entertainment of rational creatures.”
Researching the House of Commons, 1832-1868
Articles and research from the History of Parliament Trust
Reflections on books and art
Posts on the History of Law, Crime, and Justice
Celebrating humanity's flourishing through the spread of capitalism and the rule of law
Exploring the Monarchs of Europe
Cutting edge science you can dice with
Small Steps Toward A Much Better World
“We do not believe any group of men adequate enough or wise enough to operate without scrutiny or without criticism. We know that the only way to avoid error is to detect it, that the only way to detect it is to be free to inquire. We know that in secrecy error undetected will flourish and subvert”. - J Robert Oppenheimer.
The truth about the great wind power fraud - we're not here to debate the wind industry, we're here to destroy it.
Celebrating humanity's flourishing through the spread of capitalism and the rule of law
Celebrating humanity's flourishing through the spread of capitalism and the rule of law

Recent Comments