
Nurses against vaccines!
13 Dec 2014 Leave a comment
in health economics, occupational choice Tags: anti-vaccination movement, vaccinations, vaccines
How New Zealand’s rich-poor divide killed its egalitarian paradise | Max Rashbrooke | The Guardian – a boy’s own fact check
13 Dec 2014 Leave a comment
in discrimination, gender, labour economics, poverty and inequality Tags: gender wage gap, Gini coefficient, poverty and inequality, top 1%
What is claimed to have gone wrong by the op-ed in The Guardian overnight?
A stark rich-poor divide, the OECD argued, had taken over a third off the country’s economic growth rate in the last 20 years. But how could this be?
The simple answer is that in the two decades from 1985 onwards, New Zealand had the biggest increase in income gaps of any developed country.
Incomes for the richest Kiwis doubled, while those of the poorest stagnated. Middle income earners didn’t do too well, either.
Are these claims true? That is, in the two decades from 1985 onwards, have the incomes of the richest Kiwis doubled, while those of the poorest stagnated and have a middle income earners not done too well either?
Figure 1 shows that prior to the recent recession starting in 2009, there were 15 years of steady growth in median household incomes. As will be shown, most of the period covered both by the op-ed in the Guardian, and by the OECD paper was an economic boom.
Figure 1: Real household income trends before housing costs (BHC) and after housing costs (AHC), 1982 to 2013 ($2013)

Source: Bryan Perry, Household incomes in New Zealand: Trends in indicators of inequality and hardship 1982 to 2013. Ministry of Social Development (July 2014).
Perry (2104) found that net income gains from the mid-1990s to 2013 were similar for all income groups, so income inequality in 2013 was also similar to the mid-1990s – see Figure 2.
Figure 2: Real household incomes (BHC), changes for top of income deciles, 1994 to 2013
![clip_image002[7]](https://utopiayouarestandinginit.com/wp-content/uploads/2014/12/clip_image0027.png "clip_image002[7]")
Source: (Perry 2014).
Importantly, in the OECD analysis, much was made of what was happening to the 40% income decile. As can be seen from figure 2, this decile gained as much as any other group in New Zealand from the income growth between 1994 and 2013.
The Gini coefficient in figure 3 , which years the most common measure of inequality, shows no evidence of a rise in income inequality since the mid-1990s. The trend-line of the genie coefficient in figure 3 is almost flat since the early 1990s .
Figure 3: Gini coefficient New Zealand 1980-2015

Source: (Perry 2014).
To make things more awkward, the large increase in income inequality in New Zealand in the late 1980s and early 1990s shown in figure 3 was followed by a 15 year economic boom after 20 years of economic stagnation – next to no income growth – as is shown in figure 4.
Figure 4: Real GDP per New Zealander and Australian aged 15-64, converted to 2013 price level with updated 2005 EKS purchasing power parities, 1956-2013

Source: Computed from OECD Stat Extract and The Conference Board, Total Database, January 2014, http://www.conference-board.org/economics
The lost decades of the growth in the 1970s and 1980s were replaced with a long boom. Trend growth of 2% per year returned after this increase in inequality – see figure 4.
The gains since the economic boom since the early 1990s has been broadly based both up and down the income distribution and by ethnicity. As shown in figure 5, between 1994 and 2010, real equivalised median household income rose 47% from 1994 to 2010; for Māori, this rise was 68%; for Pasifika, the rise was 77%.
Figure 5: Real equivalised median household income (before housing costs) by ethnicity, 1988 to 2013 ($2013).
![clip_image002[9]](https://utopiayouarestandinginit.com/wp-content/uploads/2014/12/clip_image00292.png "clip_image002[9]")
Source: (Perry 2014).
These improvements in Māori incomes since 1992 were based on rising Māori employment rates, fewer Māori on benefits, more Māori moving into higher paying jobs, and greater Māori educational attainment should be celebrated and consolidated. Māori unemployment reached a 20-year low of 8 per cent from 2005 to 2008.
As for the top 1%, as shown by Figure 6, their income share has been steady at 8-9% since the mid-1990s. It was only in the USA the top 1% share continued to rise strongly, from 13% to 19%.
Figure 6: income shares of the top 1% of earners, New Zealand, Australia and USA

source: Top incomes database
Over the last more than two decades in New Zealand, there has been sustained income growth spread across all of society. Perry (2014) concluded that:
Overall, there is no evidence of any sustained rise or fall in inequality in the last two decades.
The level of household disposable income inequality in New Zealand is a little above the OECD median.
The share of total income received by the top 1% of individuals is at the low end of the OECD rankings.
What is claimed as the causes of this growing rich-poor divide that is also slowing growth by a third?
Tracing the causes of a growing income gap is like trying to map earthquake fault lines – never a precise science – but it is hard to ignore the correlation between the timing of the increase and the country’s post-1984 political revolution.
Embracing reforms known elsewhere as Thatchernomics and Reaganomics with unprecedented enthusiasm, New Zealand halved its top tax rate, cut benefits by up to a quarter of their value, and dramatically reduced the bargaining power – and therefore the share of national income – of ordinary workers.
Thousands of people lost their jobs as manufacturing work went overseas, and there was no significant response with increased trade training or skills programmes, a policy failure that is on-going.
At the same time, New Zealand stopped building affordable houses in any serious quantity, forcing poorer households to spend ever-increasing amounts on rent and mortgages.
As will be recalled from Figure 4, the economic reforms in New Zealand were followed by a long economic boom starting in 1992 that only came to an end with the onset of the global financial crisis.
Figure 7 shows that from 1994, the proportion of the lowest income households spending more than 30% of their income on housing fell steadily, reaching 34% by 204.
Figure 7: Proportion of households spending more than 30% of their income on housing costs by income quintile, New Zealand 1988–2013 HES years

Source: Perry (2014)
Housing affordability was improving for much of the period in which the op-ed in the Guardian was claiming it was getting worse. The increase in housing unaffordability in the late 1980s and early 1990s coincided with a deep recession and a cut in welfare benefits.
Housing affordability has become an issue in New Zealand because of rising prices. Supply is not keeping up with demand.
There were considerable increases in prices throughout the house price distribution between 2004 and 2008. Median house price increasing by over 50% between 2004 and 2008; the price rises were largest among the lower price houses.
It was not a case of a decline in demand under the hypothesis that is put forward in the op-ed in the Guardian. For that hypothesis to hold, housing prices would somehow have to fall in the price range of ordinary workers. That is not the case.
Furthermore, the large increase in housing prices and decline in housing affordability occurred a decade and more after the increase in inequality in the late 1980s and early 1990s. The timing is out.
Another inconvenience for the rich poor divide hypothesis is during the housing price boom after 2004 rent to disposable income for all income quintiles remained relatively constant. Rents were stable.
Poorer households are more likely to rent, and therefore much less likely to be affected by the housing affordability crisis in New Zealand as that was mostly about home ownership.
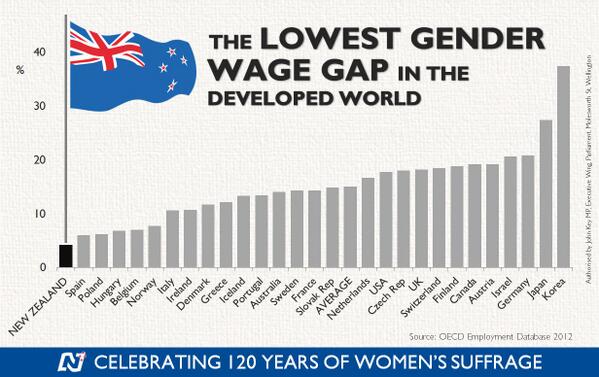
Gender analysis! Gender analysis? Where is the gender analysis? Over the last 20 to 30 years, the gender gap has closed substantially in terms of wages and employment. Young women now outnumber young men two to one at university.

New Zealand has the smallest gender wage gap in the Western world. That is inconsistent with the notion in New Zealand has a rich poor divide. Instead New Zealand appears to be an egalitarian paradise as long as you are not a boy!
The major driver of inequality in New Zealand and overseas is the rising number of two-income households made up of two well-educated parents and one or two children and many more single parent households on low pay or no one in paid employment in the house. Well-educated couples form into high income households; fewer of the less educated marry and too many end up a single mothers.

Source: closertogether.org.nz
The main cause of poverty in New Zealand is dependency on welfare benefits and in particular the number of single parents. Child poverty in beneficiary families is 75% to 80%, much higher than in families with at least one adult in full-time employment (11% in 2012 and 2013). The payment of welfare benefits to families who do not work guarantees an income to people not in a job, but it creates incentives not to work.

The economic and sociological literatures overseas increasingly suggesting that skill disparities resulting from a lower quality education and less access to good parenting, peer and neighbourhood environments produce most of the income gaps of racial and ethnic minorities rather than factors such as labour market discrimination.
Policy bubbles alert: can more money reduce child poverty?
12 Dec 2014 Leave a comment
in labour economics, welfare reform Tags: capitalism and prosperity, poverty and inequality, Susan Mayer, The Great, the withering away of the proletariat, welfare reform
 Susan Mayer in her book What Money Can’t Buy found very little evidence to support the widely held belief that parental income has a significant effect on children’s life outcomes. Mayer:
- Challenged the assumption that poverty directly causes poor health, behavioural problems, and a host of other problems for children;
- Also stated that there was no correlation but a coincidence with a missing third factor, which was jobs; and
- Found that household conditions are highly responsive to income but how it is spent is what matters more.
These findings were Susan Mayer are of profound importance because far too many people believe the solution to child poverty is to give the poor more money. What could be simpler.
Capitalism have been giving the poor more money for centuries now. This great enrichment dwarfs anything that redistribution and egalitarian politics and the welfare state has done in the 20th century.
Mayer said that her findings do not endorse massive cuts in welfare:
My results do not show that we can cut income support programs with impunity…
Indeed, they suggest that income support programs have been relatively successful in maintaining the material living standard of many poor children.
Mayer found that non-monetary factors play a bigger role than previously thought in determining how children overcome disadvantage as she explains.
Parent-child interactions appear to be important for children’s success, but the study shows little evidence that a parent’s income has a large influence on parenting practices.
Mayer said that if money alone were responsible for overcoming such problems as unwed pregnancy, low educational achievement and male idleness, states with higher welfare benefits could expect to see reductions in these problems. In reality,
once we control all relevant state characteristics, the apparent effect of increasing Aid to Families with Dependent Children benefits is very small
Mayer is of the view that many of the activities that improve children’s outcomes are more related to parenting choices than to income:
They mainly reflect parents’ tastes and values.
Books appear to benefit children because parents who buy a lot of books are likely to read to their children.
Parents who do not buy books for their children are probably not likely to read to them even if the books are free, and parents who do not take their children on outings may be less likely to spend time with them in other ways.
Among her findings, which have largely survive the test of time, are:
- Higher parental income has little impact on reading and mathematics test scores.
- Higher income increases the number of years children attend school by only one-fifth of a year.
- Higher income does not reduce the amount of time sons are idle as young adults.
- Higher income reduces the probability of daughters growing up to be single mothers by 8 to 20 percent.
Mayer found that as parents have more money to spend, they usually spend the extra money on food, especially food eaten in restaurants; larger homes; and on more automobiles.
As a result, children are likely to be better housed and better fed, but not necessarily better educated or better prepared for high-income jobs. This is her key conclusion about what money can and cannot buy:
If we are asking specifically about the relationship between parental income and children’s outcomes, a fairly clear answer is emerging: parental income itself has a modest effect on children’s outcomes and this effect is not necessarily greater for children from poor families compared to children from rich families.
Mayer’s analysis in many ways reflects her own life story. She divorced in the mid-1970s and had so many money troubles that she had trouble paying the rent.
She remarried in the early 1980s and had a second child. This second child at a comfortable middle-class upbringing. The mother went on to complete a Ph.D. and ended up as head of the Harris School of Public Policy at the University of Chicago.
Mayer noticed that both of her children turned out pretty much the same despite the older child was raised in poor circumstances. The common factor to this success was they had the same mother.
Why Lefties Make Less – The Atlantic
12 Dec 2014 Leave a comment
in human capital, labour economics Tags: wage gaps

Recessions as reorganisations
12 Dec 2014 Leave a comment
in business cycles, F.A. Hayek, history of economic thought, job search and matching, macroeconomics, Robert E. Lucas, unemployment Tags: FA Hayek, recessions, recoveries, Robert Lucas

Most models of the shape of recoveries draw on a learning process. A long tradition in business cycle theory holds that limited knowledge of relative price changes can temporarily disrupt labour demand and supply because of errors in wage and price perceptions (Alchian 1969; Sargent 2007; Hellwig 2008).
Pricing, investment and production plans are made on the basis of incomplete and conflicting knowledge of constantly changing aggregate, industry and local conditions. Firms and workers will over- or under-supply when they misperceive wages and prices.
With imprecise information, it takes time for employers and workers to sort out temporary from permanent shifts in demand and supply, inflation-driven changes from real changes in prices and input costs, and general changes from the local changes that may be more important to particular firms. As Hayek explained in his Nobel prize lecture:
The true, though untestable, explanation of extensive unemployment ascribes it to a discrepancy between the distribution of labour (and the other factors of production) between industries (and localities) and the distribution of demand among their products.
This discrepancy is caused by a distortion of the system of relative prices and wages. And it can be corrected only by a change in these relations, that is, by the establishment in each sector of the economy of those prices and wages at which supply will equal demand.
Recoveries are shaped by the speed of entrepreneurial learning about the new labour and product market conditions, the relative cost of adjusting capital and labour rapidly or slowly and the costs and benefits of labour market search. This new learning is necessary because the old constellation of prices and wages is no longer valid.
It was a misdirection of resources brought about by the initial inflationary firm, as Hayek explained in a visit to Australia in 1950:
During a process of expansion the direction of demand is to some extent necessarily different from what it will be after expansion has stopped.
Labour will be attracted to the particular occupations on which the extra expenditure is made in the first instance.
So long as expansion lasts, demand there will always run a step ahead of the consequential rises in demand elsewhere.
And in so far as this temporary stimulus to demand in particular sectors leads to a movement of labour, it may well become the cause of unemployment as soon as the expansion comes to an end…
If the real cause of unemployment is that the distribution of labour does not correspond with the distribution of demand, the only way to create stable conditions of high employment which is not dependent on continued inflation (or physical controls), is to bring about a distribution of labour which matches the manner in which a stable money income will be spent.
This depends of course not only on whether during the process of adaptation the distribution of demand is approximately what it will remain, but ‘also on whether conditions in general are conducive to easy and rapid movements of labour.
In a recession, employers and workers do not immediately know that demand has fallen elsewhere as well as in their own local markets and recognise the need to adjust to their poorer prospects everywhere, and it is not known how long the drop in demand will last (Alchian and Allen 1973).
The cost of learning about available opportunities restricts the speed of a recovery. Workers and entrepreneurs must gather information on the new state of demand and the location and nature of new opportunities. This information is costly and is quickly made obsolete by further changes, and the cost of acquiring information is more costly the faster the information is sought to be acquired (Alchian 1969; Alchian and Allen 1967).

The process of recovering from a recession would be a faster process if the new constellation of wages and prices that are the best alternative uses of resources was known immediately and was credible to firms and workers (Alchian and Allen 1973).
Workers and employers must first have sufficient time to discover what new knowledge they now need to know to serve their interests well, leave enough room for the unforeseeable and keep their knowledge fresh in ever-changing markets.
New wage levels must be created by workers and employers testing and retesting in the labour market the new relative scarcities of labour. Imbalances between the allocation of labour supply and demand to different firms and sectors and the new level and pattern of consumer demand are gradually remedied by changes in relative prices and wages, layoffs, business closures and job search.

Prices are a signal wrapped in an incentive. Growing demand induces higher employment and rising wages. Wages stagnate, and there are layoffs where there is an excess supply.
These changes give the unemployed an incentive to move to new uses and entrepreneurs to profitably hire the unemployed. The ensuing reorganisations are time-consuming and information-intensive because a job seeker and an employer with an apt vacancy take time to find each other.
Prices and wages must change sufficiently for firms to profitably create new jobs. New jobs require time to plan and build new job capital. This is the human, physical and organisational capital underlying a new job. There are also job creation costs when reopening existing positions that were mothballed during the downturn.
How is this to be done? Hayek explained again in 1950 in his speech in Australia:
Full employment policies as at present practised attempt the quick and easy way of giving men employment where they happen to be, while the real problem is to bring about a distribution of labour which makes continuous high employment without artificial stimulus possible.
What this distribution is we can never know beforehand. The only way to find out is to let the unhampered market act under conditions which will bring about a stable equilibrium between demand and supply.
Is welfare dependence optimal for whom – part 5: higher abatement rates and labour supply
12 Dec 2014 Leave a comment
in labour economics, labour supply, poverty and inequality, welfare reform Tags: labour economics, welfare reform
Paradoxically, the main way of using financial incentives to increase net labour supply of beneficiaries and move more off the benefit is to toughen the benefit abatement regime.
This increase in the abatement rates on welfare benefits for earned income moves more off the benefit and moves more into full-time employment but still with an ambiguous effect on part-time employment. Some may prefer the benefit over their current part-time job.
The notion that tinkering with financial incentives will not have large effects on labour supply and benefit numbers is not new. Increase in the generosity of welfare benefits with increase the number of applicants.
Tinkering with the details of abatement rates and thresholds has ambiguous labour supply effects because exits from welfare are still offset by new entry onto welfare. The netting the labour supply changes of these diverse groups often leads to welfare reform leading to positive but small change in labour supply. Quantitatively, an old finding is the remarkable lack of effects of financial incentives on welfare participation (Moffitt 1992, 2002).
Under a move up to a 100 per cent benefit abatement rate as shown in Figure 1; arrow 1 in Figure 1 shows that some who were working part-time will now find not working at all to be the more attractive option. The new 100 per cent benefit abatement rate reduces their take-home pay but they enjoy more leisure time.
Figure 1: the labour supply effects of an increase to a 100 per cent benefit abatement rate

Arrow 2 in Figure 1 shows that some part-time workers increase their working hours because working a little more mitigates the reduction in their take-home pay and allow some leisure time.
Arrow 3 in Figure 1 shows that some part-timers return to full-time working hours because of the revised leisure-labour trade off that now makes a somewhat higher take-home pay worthwhile despite reduced leisure time.
Whether net labour supply increases or falls after a rise in the benefit abatement rate to 100 per cent depends on the relative numbers of workers at different points on the budget constraint that are working full-time, not working, and working part-time and the magnitudes of their responses.
Some will stay as they are working either full-time, not working or working part-time. Others supply more labour. Working more hours may increase their take-home pay depending on how productivity they are.
Some part-timers will move to full-time in low paid jobs with take-home pay because of the loss of benefit income, they will enjoy less leisure time and there can be additional costs such as child care.
More productive workers in better paid jobs will take home more in pay by moving to full-time but will enjoy less leisure time. Some workers that were previously working part-time stop working and rely in welfare benefits.
If reduced welfare dependence is the objective, high abatement rates and low abatement thresholds are the path to follow. With a move to 100 per cent abatement of benefits, some leave the welfare system but no one joins it because of the higher abatement rate.
Less generous abatement will see some who claim the benefit while working part-time move to a lower take-home pay. Some will be on a higher take-home pay working full-time. The net labour supply effect is ambiguous because some leave work altogether while others work more hours.
The net labour supply depends on the relative numbers at different points on the budget constraint working full-time, not working, or working part-time and the magnitudes of their respective individual labour supply responses. Some people will stay as they are working full-time, not working or working part-time.
No one who previously did not work is worse off under the benefit abatement rate increase to 100 per cent because they are unaffected by abatement. Some who were working part-time and previously claiming the benefit take-home less but enjoy more leisure as shown by arrow 2 in Figure 1. The remaining part-time workers now take-home more pay but enjoy less leisure because they are working more hours and even full-time as shown by arrow 3 in Figure 1.
The blogs so far
part-one-the-labour-leisure-trade-off-and-the-rewards-for-working
part-two-the-labour-supply-effects-of-welfare-benefit-abatement-rate-changes
part-3-abatement-free-income-thresholds-and-labour-supply
part-4-in-work-tax-credits-and-labour-supply
part-5-higher-abatement-rates-and-labour-supply
What is the main driver of a gender wage gap?
12 Dec 2014 Leave a comment
in applied welfare economics, discrimination, gender, labour economics, liberalism, organisational economics, personnel economics


Tom Sargent’s Keynote Address BYU CPEC 2012 on taxation and redistribution
11 Dec 2014 Leave a comment
in fiscal policy, labour economics, labour supply, macroeconomics, public economics Tags: taxation and the labour supply, Tom Sargent
Charles Murray and the OECD’s Trends in Income Inequality and its Impact on Economic Growth – IQ, signalling, over-education and plain bad career advice
11 Dec 2014 Leave a comment
in economics of education, human capital, international economics, labour supply, occupational choice, poverty and inequality Tags: Bryan Caplan, Charles Murray, IQ and education, poverty and inequality, signalling
Charles Murray has been cooking with gas lately – on fire. One of his points is too many go to college. Murray points out that succeeded at college requires an IQ of at least 115 but 84% of the population don’t have this:
Historically, an IQ of 115 or higher was deemed to make someone “prime college material.”
That range comprises about 16 per cent of the population.
Since 28 per cent of all adults have BAs, the IQ required to get a degree these days is obviously a lot lower than 115.
Those on the margins of this IQ are getting poor advice to go to college. Murray argues that other occupational and educational choices would serve them better in light of their abilities and likelihood of succeeding at college. Moreover, Murray is keen on replacing college degrees with certification after shorter periods of study such as in the certified public accountants exam.
Murray believes a lot of students make poor investments by going on to College, in part, because many of them don’t complete their degrees:
…even though college has been dumbed down, it is still too intellectually demanding for a large majority of students, in an age when about 50 per cent of all high school graduates are heading to four-year colleges the next fall.
The result is lots of failure. Of those who entered a four-year college in 1995, only 58 per cent had gotten their BA five academic years later.
Murray does not want to abandon these teenagers:
Recognizing the fact that most young people do not have ability and/or the interest to succeed on the conventional academic track does not mean spending less effort on the education of some children than of others.
…Too few counsellors tell work-bound high-school students how much money crane operators or master stonemasons make (a lot).
Too few tell them about the well-paying technical specialties that are being produced by a changing job market.
Too few assess the non-academic abilities of work-bound students and direct them toward occupations in which they can reasonably expect to succeed.
Worst of all: As these students approach the age at which they can legally drop out of school, they are urged to take more courses in mathematics, literature, history and science so that they can pursue the college fantasy. Is it any wonder that so many of them drop out?
To add to that, he is in the Bryan Caplan School: education is often an elaborate former of signalling for many degrees. Murray says that college is a waste of time because:
Outside a handful of majors — engineering and some of the sciences — a bachelor’s degree tells an employer nothing except that the applicant has a certain amount of intellectual ability and perseverance.
Even a degree in a vocational major like business administration can mean anything from a solid base of knowledge to four years of barely remembered gut courses.
If the OECD is to be believed, that not enough people are going to college from lower middle class families, obviously IQ is not one of the constraints on access to college Charles Murray suggested it to be.

The growing strength of the case that education is a form of signalling is a literature that the now famous OECD paper reviewed, found wanting, but did not have time to discuss in the working paper.

Another contemporary theme the OECD paper reviewed, found wanting, but did not have time to discuss is a large number of graduates who end up holding jobs that do not require a university education – going to college:
About 48 per cent of employed U.S. college graduates are in jobs that the Bureau of Labor Statistics (BLS) suggests requires less than a four-year college education.
Eleven per cent of employed college graduates are in occupations requiring more than a high-school diploma but less than a bachelor’s, and 37 per cent are in occupations requiring no more than a high-school diploma.
The proportion of overeducated workers in occupations appears to have grown substantially; in 1970, fewer than one per cent of taxi drivers and two per cent of fire-fighters had college degrees, while now more than 15 per cent do in both jobs
All in all, the OECD has gone into the dragons den by backing the accumulation of human capital as its mechanism to link inequality with lower growth. No matter how you spin it, this linking of lower economic growth to greater inequality through financial constraints on the accumulation of human capital by the lower middle class was a bold hypothesis.

The case for investing more in education is not a slam dunk. Higher education – university or polytechnic – is a rat race that many don’t need to join.The case for the government paying a great many more to join that rat race is rather weak.
Trends in Income Inequality and its Impact on Economic Growth – OECD – is it all about not enough graduates – updated?
11 Dec 2014 Leave a comment
in economics of education, human capital, labour economics, occupational choice, poverty and inequality Tags: educational attainment, human capital, poverty and inequality, student loans, tuition fees
The analysis of the OECD published overnight depends crucially upon how greater inequality reduces the ability of the lower income families to invest in human capital.
The OECD theory of inequality and lower growth is there is a financing constraint because of inequality that reduces economic growth because of less human capital accumulation by lower income families.
Proportion of adults aged 25–64 years with an educational qualification of at least upper secondary level and tertiary level, 1991–2009

In a nutshell, not enough people are going to university. Apparently, the explosion in tertiary educational attendance over the last generation, an increase of about 150% for the adult population aged 25 to 64, was just not good enough.
But what about adults aged 25 to 34, recent graduates, how many of them are there?

There was an explosion of young New Zealanders in the late 1990s who qualified for a degree from a university or diploma from a Polytech.
Under the hypothesis of the OECD about financial constraints retarding the accumulation of human capital among the lower middle class – the fourth decile of the income distribution – even more young New Zealanders should have gone to university or Polytech.
Are there many New Zealanders left who are qualified and suited to tertiary education who do not go?
That is the crux of the OECD position: not enough lower-middle-class New Zealanders go on to obtain higher education and upgrade their skills because of financial constraints in a country was in interest free student loans, means tested student allowances, and the government subsidises for 75% of all tuition fees. Tuition fees only equal 25% of the actual cost and any one can get a student loan to cover this fee.
Some economics of the marriage bars (and mandatory retirement ages)
11 Dec 2014 1 Comment
in discrimination, gender, labour economics, personnel economics Tags: employer discrimination, gender wage gap, lump of labour fallacy, marriage bar, seniority pay, sex discrimination
Up until 1966, women had to quit from the Australian Public Service when they married! The bar was repealed in 1966 with a private members bill by Bill Hayden.
Some hid their marriages for years, hiding their rings before they got to work.
One woman remained unmarried and bore four children. She managed this by timing her annual leave to cover the births.
While her personnel area was co-operative, they forced her to resign her middle management position when she decided to make an honest man of her de facto husband by marrying the father of their children.
Claudia Goldin found that marriage bars were policies adopted by firms and local school boards, from about the early 1900’s to 1950. They fired single women when they married and would not not to hire married women.
The marriage bar, which had at its height affected 751 of all local school boards in the USA and more than 50% of all office workers, was virtually abandoned in the 1950’s when the cost of limiting labour supply greatly increased.
When marriage bars disappeared, Goldin found that older female workers in the mid-1950’s were suddenly praised for their “maturity, reliability, neat appearance, and less chatty nature”.
In retail trades, and especially in suburban retail shops, Goldin found that older married women with absolutely no previous training were now the “ideal employee”; the middle-class woman were “naturally courteous” and “well-bred,” and who did not have to work became the preferred recruits of the major department stores. the best female employee was, in the words of a Sears, Roebuck, and Co. officer
a married woman with a mortgage on her house and her children partially raised
These sudden changes in the attitude of employers towards the recruitment of women of different ages and marital status suggests that the previous personnel policies were disciplined by competition.
Marriage bars, in the private sector, were instituted by large firms with centralised hiring promotion and salary schedules that were often fixed and based on tenure with the firm, and other modern employment practices.
This evidence suggested to Claudia Goldin that firms may have wanted to encourage turnover when earnings rose more rapidly with tenure than productivity. These employers in firms with rigid wage systems, tied to their workers’ seniority, desired a young, inexperienced work force. Goldin hypothesise that the marriage bar was a socially acceptable way of terminating the employment of young women whose wages would eventually rise to exceed their addition revenue to the firm.
Goldin suggested that the marriage bar had some relationship to seniority pay, as discussed by Edward Lazear.
Under seniority pay, and employees paid less than their productivity in their early years of employment but more in their later years of employment up to say a retirement date.

By back loading salary, the employer could economise on the cost of monitoring the employee’s performance and especially so in jobs where it was hard to evaluate performance. Because of the prize at the end of the road: a large salary paid towards the end of a career, an employee had more reasons to be honest and not to underperform and risk dismissal.
Not all workers may be compensated under long-term seniority pay contracts. Routine office workers, support staff, sales agents, and so on appear to be compensated on a spot basis rather than under long-term incentive contracts.
Workers in these more routine occupations have lower monitoring costs. Their productivity can be more easily and cheaply measure directly.
There is no need for sophisticated incentive contracts as is the case more often with managerial Employees and workers who hold positions of trust. In both cases , the back loading a salary operates as a bond against poor performance and dishonesty.

Most women entered the workforce by the age of 18 in the mid to early 20th century. They married in their early to mid-20s. This meant that the maximum length of their career with the firm would be 5 to 7, maybe 10 years.
Because these women are often assigned to low skilled clerical duties where there are a few promotion prospects, the productivity of these women did not increase much with time in the job.
To make sure that some women didn’t stay on to receive the seniority based salary increases by not marrying, Goldin found that some firms offered a substantial dowry is to women when they married if that already been with the firm for six years.
These dowries were buying women out of jobs where their wages were rising, but their productivity was stable.
Another advantage of buying women out of their jobs when they married was that the male co-workers didn’t have to be paid a wage premium for less job security can as they themselves could be dismissed on similar grounds.
Marriage bars were found by Goldin to be associated with fixed salary scales, internal promotion, and other personnel practices and they are not associated with piece-rate work.
Subsequent work on mandatory retirement ages in the public private sector found a similar link to both seniority pay and organisational architecture and the the limits of individual managerial discretion over firing.
The organisational architecture of a firm encompasses the assignment of decision rights within the firm, the methods of rewarding individual employees, and the structure of the systems that evaluate the performance of individual employees and business units.
Some larger firms may struggle to administer internal corporate governance structures which permit more local managerial discretion over employment relationship matters and still properly control the costs of a more diverse workforce.
A price of growth in the size of a firm is often the standardisation of products, workforce compositions and terms of employment.
When mandatory retirement was lawful, large firms with centralised personnel structures are more often to be found to have mandatory retirement ages.
The nub of the problem is large firms have several layers of management with fairly strict limits on what each individual line manager can do (Williamson 1975, 1985; Fama and Jensen 1983b).
There must be limits on local managerial discretion because the owners and senior managers set the strategic direction of the firm, the products it sells, and how many workers are employed and on what wages.
Larger firms may struggle with striking the most profitable balance between greater local managerial discretion and effective corporate governance of a large diverse organisation with professional managers and diffuse ownership structures. It will be shown that very large firms promulgate rigid personnel policies while smaller firms are much more flexible in their deals with individual employees.
This balance between local managerial discretion and central control must extend to wages and hours because labour costs make up much of the costs of many firms. Changes in policies on wages and conditions are subject to ratification and monitoring by head office and the corporate board in managerial firms.
This increasing rigid separation of decision management rights from decision control rights as a managerial firm grows will restrict flexibility in terms of employment, including phased retirements. Top level managers and board members both have limited amount of time to allocate, limited spans of control, and will have less and less detailed knowledge of their firm as it grows.
Limits on the degree of local managerial discretion over employment relations in large managerial firms can arise from restrictions on managerial delegations, divided decision making rights, hierarchical approval procedures, and the breath and content of wage and personnel policies. This can include not having a personnel policy on the availability of phased retirements. This gap can be through choice, inertia or attention to other concerns currently of a higher priority.
The discretion of supervisors in large firms over the terms and conditions of employment of individual members of their team may be limited to individual performance ratings (Gibbs and Hendricks 2004).
Smaller firms have more more discretion over retirement ages was is less of a separation of ownership and control, and owners are much more able to be on-site and of balance risks and rewards from innovations.
Good evidence to illustrate the proposition that larger firms prefer rigid rules over discretion in personnel policies comes from the days of mandatory retirement. Mandatory retirements can be viewed as the wholesale substitution of local managerial discretion with a single company-wide rule because larger firms find idiosyncratic decisions to be more costly (Parsons 1997).
Back when they were legal, mandatory retirements are near universal in very large workplaces, but in small to medium size firms, there were flexible retirement polices. Few very large firms reported flexible retirement polices. The smaller firms provided for policies that allowed for exceptions to mandatory retirement rules while most of largest firm reported a policy of zero exceptions to mandatory retirement rules (Parsons 1997).
The line managers in small firms were more willing to allow an older worker to work passed the usual retirement age because they had more delegations with regard to terms and conditions of employment. In addition, in smaller firms, the owners are more likely to be among the management team for the CEO and able to closely supervise the success of the discretionary decisions of junior management over conditions of employment and hiring and firing.


Recent Comments