How much do the top income earners actually earn in NZ?

Source: topincomes-parisschoolofeconomics

Note: top income share data for adults for New Zealand adults go back only as far as 1953.

To begin with, a large number of people who see themselves as middle class will have to reclassify themselves in terms of class membership.

More importantly, they will have to pick up on their class consciousness because they are either in the top 10% as any successful professional is because the average income of the top 10% in New Zealand is $128,000. With a bit of luck, these members of the ruling class will be able to afford a house in Auckland without having to borrow from mum and dad.

Pretty much every successful professional is in the top 5% in New Zealand, with an average income of $170,000.

These rich have a lot of people look down upon and order about as junior or senior members of the ruling class, even if they did know they were a member of the ruling class until they looked at the diagram above. Welcome to the ruling class. Goodbye to the middle-class. Get over it.

As for the top 1% in New Zealand, they have an average income in 2011 of $336,000. Once again, successful professionals, successful entrepreneurs and what’s left of the rentier class will have to accept that supreme power as the ruling class of the capitalist system is open to just about anybody who does well at university and enters the professions. Are there no standards?

As for the top 0.5%, data on the top 0.1% stopped in 1989, they earned an average of $457,000 a year in 2011. That is starting to look like good money, though you do have to brush shoulders with celebrities, athletes and more than a few successful small entrepreneurs, but at least you are starting to earn a lot more than your average suburban doctor who is a member of the top 10%.

The ruling class is not what it used to be – the rentier class, old money. That the rich of today – the ruling class of the capitalist system – is open to many ordinary people who are new rich or just plain urban professionals, athletes, musicians and celebrities is a common finding all round the world. As Piketty and Saez explained for the USA:

This rise in top income shares is not due to the revival of top capital incomes, but rather to the very large increases in top wages (especially top executive compensation).

As a consequence, top executives (the “working rich”) have replaced top capital owners at the top of the income hierarchy over the course of the twentieth century.

Many of the rich both in New Zealand and overseas are working rich who made their money themselves and came from middle class or upper middle-class backgrounds.

Many of these rich are well educated smart people rather than the inheritors of wealth. The working rich and most of the rich of the 21st century must be well educated because so many of them are professionals in occupations where you must succeed at university to get in the ground floor, or they are athletes, musicians and other celebrities who must work their way up from the bottom.

A large number of New Zealanders who regarded themselves as middle class action are part of the rich – the top 10%, top 5% and banging on the doors of the top 1% or better – so they better start carrying themselves about with the airs and graces of the ruling class. Better practice by putting a plum in your mouth.

p.s. There was a big spike in top incomes in 1999. It seems like a lot of people in New Zealand brought forward income in 1998 and 1999 in anticipation of the election of a Labour Party government in the 1999 New Zealand general election, and an immediate increase in the top tax rate from 33% to 39% for incomes over $60,000.


Women and Minorities in Human History

Is welfare dependence optimal for whom – part 7: the role of tagging in welfare benefits system

The unambiguously favourable labour supply effects of work requirements are often contrasted with the ambiguous results of changes in benefit abatement regimes.

The twist is work requirements need to be accompanied by a categorisation of the welfare population into those who can work and those who cannot work. The latter do need welfare support because they are unable to earn a wage in the labour market or have carer responsibilities such as for pre-schoolers.

There is already a large population on other welfare benefits with short and long-term barriers to work because of sickness or invalidity classifications.

The favourable labour supply effects of work requirements depend on an ability to adequately categorise the welfare population into different groups. The large differences between otherwise comparable countries in the number on sickness and disability benefits suggest that this classification and sorting process is knowledge intensive and error prone.

The original support for negative income taxes from Friedman (1962) and Stigler (1946) was born of the notion that welfare bureaucracies are unable to adequately screen, categorise and tag welfare claimants by their capacity to work and diligent job search in a dynamic world with dispersed knowledge and moral hazard.

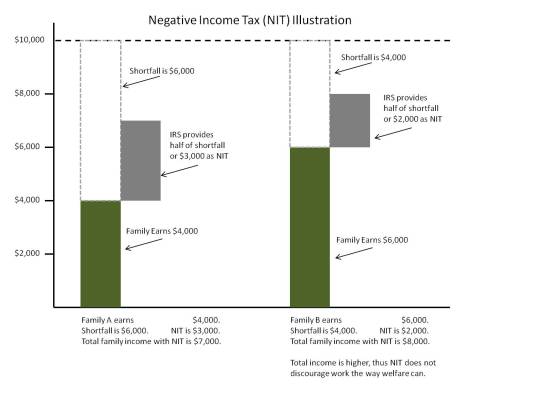
Negative income taxes were proposed as an administratively simple welfare reform to give adequate income support to the low paid, out of work and unable to work, while still providing reasonable work incentives for the low paid. The negative income tax was originally intended to replace existing welfare benefits for families at least.

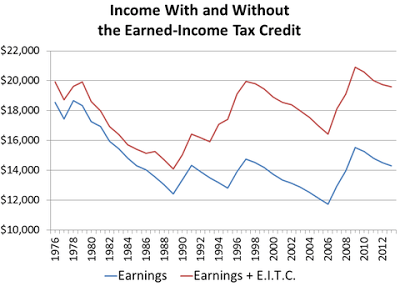
The modern incarnations of negative income taxes manifest as in-work tax credits that supplement welfare benefits and reduce poverty among the working poor.

The ambiguous effect of negative income taxes on the net labour supply among the low-paid was acknowledged at the outset, and was borne out in experimental trials and experience with in-work tax credits.

The existing system of domestic purpose, unemployment, sickness and invalid benefits are all examples of screening, categorising and tagging of welfare claimants with varying degrees of success.

The tagging is based on relatively coarse screening devices such as job loss, sole parenthood and medical grounds.

Akerlof (1978) noted that the truly needy—those with low job skills who have extreme difficulty in becoming employed—can be partly identified by some measurable, observable characteristic, which he called tagging the poor. Some combination of indications of poor health, low levels of education and spotty employment histories might be indicators of low job skills.

If the government moves from a negative income tax, in which all those with income are paid benefits regardless of their characteristics, to a tagged system in which only the subset who have the particular set of characteristics indicating that they are needy are paid benefits, then higher benefits could be paid to the tagged individuals without changing total expenditure.

Depending on whether the welfare tag is job loss, sole parenthood, sickness or invalidity, different abatement regimes, benefit levels and work tests apply. ACC is another example of tagging with the screening based on accidental injury.

Most welfare systems tag Akerlof partly with family structure in mind as a characteristic, with benefits heavily concentrated on families with a single parent.

Family tax credits are based on tagging through the number of hours worked and the number of children  that are dependent upon the wage earner.

Nichols and Zeckhauser (1982) argued that the imposition of “ordeals” on welfare recipients, of which work requirements were one example, but onerous application procedures and participation requirements are others, could serve to deter entry  of the able-bodied.

The experience with tagging to date suggest that it’s not particularly accurate.  social insurance systems for injury and illness have significant issues with moral hazard.

For example, before 15 July 1980, an employee injured in a workplace accident in Kentucky received compensations proportional to his or her wage with an upper limit of $131 per week.

On 15 July 1980, this limit was raised to $217 per week. The better paid wage-earners were substantially better compensated for accidents that occurred after that date.

The periods of convalescence of these better-paid workers grew 20 per cent longer. For accidents that occurred before 15 July, these employees had been off work for an average of 4.3 weeks; for accidents after 15 July caused the same employees to stay home for an average of 5.2 weeks.

The average convalescence period for injured workers who were less well paid was unaffected by the rise in the upper limit stayed the same before and after 15 July. It is absurd to suggest that workplace accidents had suddenly become more serious for these better-paid workers and only for them after 15 July 1980.

In the past three decades, the number of people who are on disability benefit has skyrocketed but incidence of disabling health conditions among the working age population is not rising. Autor (2006) found that disability rolls in the USA expanded because:

  • congressional reforms to disability screening in 1984 that enabled workers with low mortality disorders such as back pain, arthritis and mental illness to more readily qualify for benefits;
  • a rise in the after-tax income replacement rate, which strengthened the incentives for lower-skilled workers to seek benefits;  and
  • a rapid increase in female labour force participation that expanded the pool of insured workers.

Autor found that the aging of the baby boom generation has contributed little to the growth of disability benefit numbers to date.

David Autor and Mark Duggan (2003) found that low-skills and a poor education is predictor of disability: in the USA in 2004, nearly one in five male high school dropouts between ages 55 and 64 were in the disability program; that was more than double that of high school graduates of the same age and more than five times higher than the 3.7 % of college graduates of that age who collect disability. Unemployment is another driver of disability.

The only major success in reducing beneficiary numbers anywhere has been time limits in the USA in 1996. Time limits on welfare for single parents reduced caseloads by two thirds, 90% in some states.

The subsequent declines in welfare participation rates and gains in employment were largest among the single mothers previously thought to be most disadvantaged: young (ages 18-29), mothers with children aged under seven, high school drop-outs, and black and Hispanic mothers. These low-skilled single mothers were thought to face the greatest barriers to employment. Blank (2002) found that

nobody of any political persuasion predicted or would have believed possible the magnitude of change that occurred in the behaviour of low-income single-parent families.

Rebecca Blank is the field leader on the economics of welfare reform and got as high as Acting Secretary of the Department of Commerce for Obama.

Employment are never married mothers increased by 50% after the US reforms: employment a single mothers with less than a high school education increased by two thirds: employment of single mothers aged of 18 in 24 approximately doubled.

With the enactment of welfare reform in 1996, black child poverty fell by more than a quarter to 30% in 2001. Over a six-year period after welfare reform, 1.2 million black children were lifted out of poverty. In 2001, despite a recession, the poverty rate for black children was at the lowest point in national history.

This great success of US welfare reforms was that after decades of no progress, poverty among single mothers and among black children declined dramatically.

The best solution to poverty is to move people into a job. Simon Chapple is also quite clear in his mid-year book with Jonathan Boston that a sole parent in full-time work, and a two parent family with one earner with one full-time and one part-time worker, even at low wages, will earn enough to lift their children above most poverty thresholds. Welfare benefits trap children in poverty.

The best available analysis, the most credible analysis, the most independent analysis in New Zealand or anywhere else in the world that having a job and marrying the father of your child is the secret to the leaving poverty is recently by the Living Wage movement in New Zealand.

According to the calculations of the Living Wage movement, earning only $18.80 per hour with a second earner working only 20 hours affords their two children, including a teenager, Sky TV, pets, international travel, video games and 10 hours childcare.

This analysis of the Living Wage movement shows that finishing school so your job pays something reasonable and marrying the father of your child affords a comfortable family life.

Blogs so far:

part-one-the-labour-leisure-trade-off-and-the-rewards-for-working

part-two-the-labour-supply-effects-of-welfare-benefit-abatement-rate-changes

part-3-abatement-free-income-thresholds-and-labour-supply

part-4-in-work-tax-credits-and-labour-supply

part-5-higher-abatement-rates-and-labour-supply

part-6-mandatory-work-requirements-and-labour-supply

part-7-the-role-of-tagging-in-welfare-benefits-system

Political Calculations: What Drives CEO Pay?

Xavier Gabaix and Augustin Landier found back in 2008 that what a major company’s CEO earns is directly proportional to the size of the firm that they are responsible for running.

The chart below shows the correlation between firm size and CEO compensation for the top 500 public firms in 2010.

Executive Compensation vs Firm Size for Top 500 Firms, 2010

Executive compensation closely track the evolution of average firm value. During 2007 – 2009, firm value decreased by 17%, and CEO pay by 28%. During 2009-2011, firm value increased by 19% and CEO pay by 22%.

Executive Compensation and Firm Size for Top 500 Firms, 1992-2011

via Political Calculations: What Drives CEO Pay?.

@bryce_edwards New Zealand’s war on the poor – a fact check

Bryce Edwards has shown in today’s column that he knows nothing about inequality in New Zealand, despite the statistics being at his fingertips:

Under capitalism there’s always going to be a war against the poor.

The process by which we divide up the resources of any society normally involves exploiting the majority for the benefit of the minority.

It’s called inequality. And this is how it is in New Zealand: those who have the most power look for ways to extract that money for themselves, or at least retain the status quo.

Against this are those who want to have a more equal society. It’s an age-old political issue, and one that has traditionally been at the heart of the left-right political divide.

In 2014 this concern about inequality has been a key feature of politics, underpinning much of what has occur…

Although the rich appear to have been winning for three decades in their ‘war against the poor’, perhaps the tide is turning?

There’s still every indication of severe poverty and inequality in this country.

Firstly, inequality has not increased in New Zealand for at least 20 years when either measured in figure 1 by the Gini coefficient or in figure 2, the top 1% income shares. Both the Gini coefficient and the top 1% income shares have not risen for 20 years.

Figure 1: Gini coefficient New Zealand 1980-2015

Source: Bryan Perry, Household incomes in New Zealand: Trends in indicators of inequality and hardship 1982 to 2013. Ministry of Social Development (July 2014).

Figure 2: Top 1% income shares, USA, New Zealand and Australia, 1970-2012

Source: top incomes database

Secondly, the benefits of the economic boom that lasted 15 years from the early 1990s until the onset of the global financial crisis would spread broadly across all sections of the New Zealand community. As shown in figure 3, both before and after housing costs increased. As shown in figure 4, real household incomes increased pretty much evenly across all of the 10 income deciles between 1994 and 2013.

Figure 3: Real household income trends before housing costs (BHC) and after housing costs (AHC), 1982 to 2013 ($2013)


Source: Bryan Perry, Household incomes in New Zealand: Trends in indicators of inequality and hardship 1982 to 2013. Ministry of Social Development (July 2014).

Figure 4: Real household incomes (BHC), changes for top of income deciles, 1994 to 2013


Source: Bryan Perry, Household incomes in New Zealand: Trends in indicators of inequality and hardship 1982 to 2013. Ministry of Social Development (July 2014).

Thirdly, as shown in figure 5, between 1994 and 2010, real equivalised median household income rose 47% from 1994 to 2010; for Māori, this rise was 68%; for Pasifika, the rise was 77%. Median household income increases of nearly 50% in 16 years should be celebrated.

Figure 5: Real equivalised median household income (before housing costs) by ethnicity, 1988 to 2013 ($2013).


Source: Bryan Perry, Household incomes in New Zealand: Trends in indicators of inequality and hardship 1982 to 2013. Ministry of Social Development (July 2014).

The massive improvements in Māori incomes since 1992 were based on rising Māori employment rates, fewer Māori on benefits, more Māori moving into higher paying jobs, and greater Māori educational attainment. Māori unemployment reached a 20-year low of 8 per cent from 2005 to 2008.

Over the last more than two decades in New Zealand, there has been sustained income growth spread across all of New Zealand society contrary to the warmed over Marxism of Bryce Edwards. Perry (2014) reviews the data every year for the Ministry of Social Development. He concluded that:

Overall, there is no evidence of any sustained rise or fall in inequality in the last two decades.

The level of household disposable income inequality in New Zealand is a little above the OECD median.

The share of total income received by the top 1% of individuals is at the low end of the OECD rankings.

Bryce Edwards’ analysis was in the typical Marxist tradition – it had no gender analysis. He failed to mention that New Zealand has the smallest gender wage gap of all the industrialised countries.

As he did not notice these great successes in household incomes, incomes of every decile, Māori economic development and the empowerment of women, Bryce Edwards had nothing to add in terms of either consolidating or improving on them.

How Americans die on the job in one chart

Job deaths chart

Image

Further evidence of the dynamic, deregulated nature of the New Zealand labour market

The chart below shows that New Zealand is far more flexible than Western Europe and is pretty near the USA in terms of people moving in and out of the unemployment pool every month with great ease. There are very high outflow rates from unemployment among the Anglo-Saxon and Nordic economies. The economies of Continental Europe stand in stark contrast. Unemployment outflow rates in these economies lie below 10% at a monthly frequency.

image

Source: Unemployment Dynamics in the OECD, Elsby, Hobijn  and Şahin (2013).

EITC is better than the Minimum Wage

via Greg Mankiw’s Blog: EITC is better than the Minimum Wage.

Greg Mankiw on the early problems of Keynesian macroeconomics

Image

WH Hutt on job search

Unemployment, job search, search and matching

Karl Marx’s forecasting ability

Image

Is welfare dependence optimal for whom – part 6: mandatory work requirements and labour supply

A mechanism for reducing welfare programme entries while increasing welfare exits is work requirements. These minimum hours can be spent working part time, in study and training, work preparation and job search assistance or volunteering.

A work requirement is a screening device removes any advantage of moving on to welfare in terms of more leisure time. U.S. welfare reform side-stepped the problem of programme entry with lifetime time limits on eligibility and work requirements making entry unrewarding. A lifetime time limit on eligibility also reduces inflow in to welfare receipt because workers have an incentive to bank their eligibility to hard time arise. Different work tests and abatement regimes that vary with circumstances on length of time on the benefit also increase exits without increasing entry.

Most work requirement schemes have waivers for those unable to work. Work requirements make welfare receipt less attractive and more hassle while not making welfare receipt any more or any less financially rewarding to those in work.

The gap between working and welfare receipt is larger because of the work requirements make the benefit less pleasant but no additional cash payments are made to encourage welfare programme entry.

Most welfare systems experiment with policy options to separate those who can work from the truly needy. Changes in financial incentives arising from abatement regimes, benefit levels and benefit durations are welfare reform workhorses. The clear-cut labour supply effects of work requirements are a useful contrast to the ambiguity of labour supply changes when benefit levels and abatement regimes change.

Figure 1 illustrates work requirements by introducing a minimum working hours requirement, which eliminates part of the budget constraint before the minimum hours. Work requirements combine a negative tied transfer – an obligation to work – with cash to induce those with a higher ability to work to self-select and opt out of the welfare system entirely.

Figure 1: The labour supply effects of mandatory work requirements as a condition of welfare benefit receipt

mandatory work requirements for welfare benefits

Arrows 1, 2 and 3 in Figure 1 represent possible labour supply responses to work requirements which lead to an increase in the hours worked by different types of workers, some moving to working part-time and others not working at all.

Arrow 1 shows some beneficiaries who are marginal workers increasing their hours from zero to the minimum. Other marginal workers will work more but no longer work enough hours to qualify for a benefit as shown by arrow 2.

This increase in labour supply, as shown by arrows 1 and 2 in Figure 1, is to be expected because a work requirement eliminates welfare benefits altogether over a certain range.

Welfare payments reduce the supply of labour unambiguously so reducing the generosity of welfare reduces the disincentives to supply labour.

A work requirement also reduces entry into and increases exit from the welfare system by more persistent workers as shown by arrow 3 in Figure 1.

This welfare exit effect and entry deterrence arises from the relative non-financial rewards of working and not working have changed in favour of staying in full-time and semi-work for persistent workers temporarily on a welfare benefit.

Persistent workers gain from anticipating the onerous nature of work requirements and searching more intensively for jobs which are more stable and enduring.

These job seekers may reduce their asking wage to win a lower paid but steadier job. Seasonal and temporary jobs will be less attractive if there are work requirements.

The incentive to cycle between the benefit and part-time and full-time work including seasonal and temporary jobs are reduce because work requirements make welfare receipt more onerous.

Those job seekers with fewer outside of the workforce obligations such as young children are the most likely to move to (stable) full-time work because of work requirements.

Those with more extensive outside commitments such as pre-schoolers work the minimum hours or make other arrangements because they now fail to qualify for welfare.

A work requirement unambiguously increases net labour supply and reduces the number of people relying on the welfare system now and into the future.

In contrast to abatement regime reforms, no one enters the welfare system as a new benefit claimant as the result of introducing work requirements.

The number of people working increase and some leave welfare rather than comply with the work programmes. Work requirements make welfare receipt unambiguously less attractive and will close the gap between earning full-time wages and the net rewards of not working or part-time work and partial benefit receipt.

The 60 per cent reduction in welfare caseloads that followed the 1996 federal welfare reform in the USA that introduced work requirement and time limits on a national basis.
Welfare Caseloads have declined since 1996

The subsequent declines in welfare participation rates and gains in employment were largest among the single mothers previously thought to be most disadvantaged: young (ages 18-29), mothers with children aged under seven, high school drop-outs, and black and Hispanic mothers. These low-skilled single mothers who were thought to face the greatest barriers to employment. Blank (2002) found that:

At the same time as major changes in program structure occurred during the 1990s, there were also stunning changes in behaviour. Strong adjectives are appropriate to describe these behavioural changes.

Nobody of any political persuasion-predicted or would have believed possible the magnitude of change that occurred in the behaviour of low-income single-parent families over this decade.

The blogs so far

part-one-the-labour-leisure-trade-off-and-the-rewards-for-working

part-two-the-labour-supply-effects-of-welfare-benefit-abatement-rate-changes

part-3-abatement-free-income-thresholds-and-labour-supply

part-4-in-work-tax-credits-and-labour-supply

part-5-higher-abatement-rates-and-labour-supply

part-6-mandatory-work-requirements-and-labour-supply

part-7-the-role-of-tagging-in-welfare-benefits-system

The trade-off between hiring higher-skilled and less-skilled workers

Firms differ in the skill compositions of their labour forces because higher-skilled labour is not always the most profitable type of labour to hire.

A profit-minded firm seeks low costs per unit of labour. In truth, nothing is expensive or cheap. This is because buyers will keep buying until the marginal cost equals the marginal benefit. The next unit was not purchased because it wasn’t worth the cost. The last unit was bought because its cost just matched its benefit.

The most cost-effective labour is the labour with the lowest ratio of wages to output. Low cost per unit of output is the goal whether it is comes from low wages or high labour productivity (Lazear 1998).


The wage spread between high quality and lower quality workers is large enough such that no employer hiring lower quality workers can profitably switch to hire higher quality recruits and no firms hiring high-quality workers will switch to hire lower quality recruits (Lazear 1998).

Employers will buy more of an under-priced skill until the returns to labour equalise again across different skill levels and the hiring of any more of the hitherto mispriced skill is no longer profitable because of rising wages.

Firms of all sizes will revisit their skills strategies when market conditions change if they hope to survive in their new circumstances.

Is it really too hard for people to bother to feed their kids? – Whale Oil Beef Hooked

photo

via Is it really too hard for people to bother to feed their kids? – Whale Oil Beef Hooked | Whaleoil Media.

Does going to prison deter crime – evidence from prison overcrowding litigation

Steve Levitt is known for the clever use of data to test hypothesis, for present purposes, of the deterrent effect of prison.

The econometrics of deterrence are complicated by the fact that increases in the number of prisoners are likely to reduce crime, but rising crime rates also translate into larger prison populations. Which came first?

Levitt found a clever way of testing whether the imprisonment had a deterrent effect by looking at what happened after successful litigation against overcrowded prisons.

When prisons became less crowded, were more people willing to risk prison because it was a less unpleasant experience?

Overcrowding litigation reduces the number of people in prison, but this change in the size of the prison population is unlikely to be related to fluctuations in the crime rate.

These lawsuits affect prison populations, but may be otherwise unrelated to crime rates especially because they take a decade or more to resolve. The prison population is falling because of the successful litigation and nothing else.

In 13 states, lawsuits affected a state’s entire prison system. In the three years after a final judgement was handed down, prison populations fell by 14.3% compared to the population of the nation as a whole; violent and property crime rates increased 10.2% and 5.5% respectively.

Levitt found that the responsiveness of crime to prison populations was two to three times greater than previous studies:

For each one-prisoner reduction induced by prison overcrowding litigation, the total number of crimes committed increases by approximately 15 per year.

The social benefit from eliminating those 15 crimes is approximately $45,000; the annual per prisoner costs of incarceration are roughly $30,000.

In another study, Levitt found the quality of life in prison has a greater impact on crime than the death penalty. He showed the death rate among prisoners (the best proxy for prison conditions) is negatively correlated with crime rates, consistent with deterrence. Criminals do not like to be sent to unpleasant, dangerous prisons.

Previous Older Entries Next Newer Entries

Fardels Bear

A History of the Alt-Right

Vincent Geloso

Econ Prof at George Mason University, Economic Historian, Québécois

Bassett, Brash & Hide

Celebrating humanity's flourishing through the spread of capitalism and the rule of law

Truth on the Market

Scholarly commentary on law, economics, and more

The Undercover Historian

Beatrice Cherrier's blog

Matua Kahurangi

Celebrating humanity's flourishing through the spread of capitalism and the rule of law

Temple of Sociology

Celebrating humanity's flourishing through the spread of capitalism and the rule of law

Velvet Glove, Iron Fist

Celebrating humanity's flourishing through the spread of capitalism and the rule of law

Why Evolution Is True

Why Evolution is True is a blog written by Jerry Coyne, centered on evolution and biology but also dealing with diverse topics like politics, culture, and cats.

Down to Earth Kiwi

Celebrating humanity's flourishing through the spread of capitalism and the rule of law

NoTricksZone

Celebrating humanity's flourishing through the spread of capitalism and the rule of law

Homepaddock

A rural perspective with a blue tint by Ele Ludemann

Kiwiblog

DPF's Kiwiblog - Fomenting Happy Mischief since 2003

The Dangerous Economist

Celebrating humanity's flourishing through the spread of capitalism and the rule of law

Watts Up With That?

The world's most viewed site on global warming and climate change

The Logical Place

Tim Harding's writings on rationality, informal logic and skepticism

Doc's Books

A window into Doc Freiberger's library

The Risk-Monger

Let's examine hard decisions!

Uneasy Money

Commentary on monetary policy in the spirit of R. G. Hawtrey

Barrie Saunders

Thoughts on public policy and the media

Liberty Scott

Celebrating humanity's flourishing through the spread of capitalism and the rule of law

Point of Order

Politics and the economy

James Bowden's Blog

A blog (primarily) on Canadian and Commonwealth political history and institutions

Science Matters

Reading between the lines, and underneath the hype.

Peter Winsley

Economics, and such stuff as dreams are made on

A Venerable Puzzle

"The British constitution has always been puzzling, and always will be." --Queen Elizabeth II

The Antiplanner

Celebrating humanity's flourishing through the spread of capitalism and the rule of law

Bet On It

Celebrating humanity's flourishing through the spread of capitalism and the rule of law

History of Sorts

WORLD WAR II, MUSIC, HISTORY, HOLOCAUST

Roger Pielke Jr.

Undisciplined scholar, recovering academic

Offsetting Behaviour

Celebrating humanity's flourishing through the spread of capitalism and the rule of law

JONATHAN TURLEY

Res ipsa loquitur - The thing itself speaks

Conversable Economist

In Hume’s spirit, I will attempt to serve as an ambassador from my world of economics, and help in “finding topics of conversation fit for the entertainment of rational creatures.”

The Victorian Commons

Researching the House of Commons, 1832-1868

The History of Parliament

Articles and research from the History of Parliament Trust

Books & Boots

Reflections on books and art

Legal History Miscellany

Posts on the History of Law, Crime, and Justice

Sex, Drugs and Economics

Celebrating humanity's flourishing through the spread of capitalism and the rule of law

European Royal History

Exploring the Monarchs of Europe

Tallbloke's Talkshop

Cutting edge science you can dice with

Marginal REVOLUTION

Small Steps Toward A Much Better World

NOT A LOT OF PEOPLE KNOW THAT

“We do not believe any group of men adequate enough or wise enough to operate without scrutiny or without criticism. We know that the only way to avoid error is to detect it, that the only way to detect it is to be free to inquire. We know that in secrecy error undetected will flourish and subvert”. - J Robert Oppenheimer.

STOP THESE THINGS

The truth about the great wind power fraud - we're not here to debate the wind industry, we're here to destroy it.

Lindsay Mitchell

Celebrating humanity's flourishing through the spread of capitalism and the rule of law

Alt-M

Celebrating humanity's flourishing through the spread of capitalism and the rule of law