@mattyglesias poverty trends a good example of why americanprogress.org/issues/poverty… http://t.co/tgn7RzBKzw—
Shawn Fremstad (@inclusionist) March 28, 2015
The rising educational attainment of the poor
01 Apr 2015 Leave a comment
in economics of education, human capital, labour economics, labour supply, poverty and inequality, welfare reform Tags: educational attainment
A tale of two parents
30 Mar 2015 Leave a comment
in human capital, labour economics, labour supply, occupational choice, politics - USA, population economics, poverty and inequality, welfare reform Tags: child poverty, family demographics, family structures, single parents
Did poverty increase after the 1996 US Federal welfare reforms?
29 Mar 2015 Leave a comment
in discrimination, labour economics, politics - USA, poverty and inequality, welfare reform Tags: 1996 US welfare reforms, child poverty, poverty and inequality

The downtrodden low paid workers are experiencing the fastest wages growth
29 Mar 2015 Leave a comment

Poverty and family structure in America
28 Mar 2015 Leave a comment
in economics of love and marriage, gender, labour economics, labour supply, politics - USA, poverty and inequality Tags: child poverty, single parents

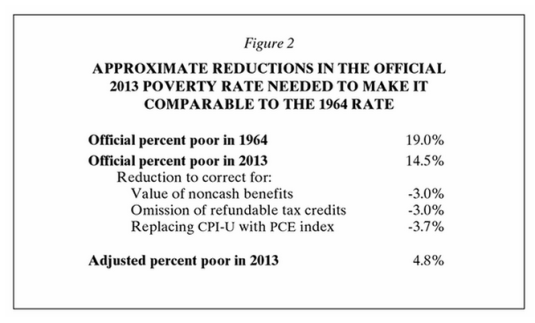
The War on Poverty was won but for a measurement error
27 Mar 2015 2 Comments
in econometerics, economic history, poverty and inequality

Why Are Unions So Focused on Fighting Trade Deals? – WSJ
23 Mar 2015 Leave a comment
in applied welfare economics, international economics, poverty and inequality, unions Tags: free trade agreements, middle-class wage stagnation

Half of all U.S. workers represented by unions work for governments, and another 12% are in education or health care. Trade has very little direct impact on them. Another 20% of workers represented by unions are in construction, wholesaling, retailing or transportation doing jobs that are largely immune from import competition.
Less than 10% of all the workers that U.S. unions represent today are in manufacturing or agriculture, the industries most exposed to harm from globalization. Trade creates winners and losers; a small fraction of union workers are among the obvious losers.
The reasons advanced by the American union movement is trade deals enhance the bargaining power of employers over workers and is a major contributor to the wage stagnation over the last 20 years.
I hope the Unions got that analysis of trade and wages growth right because most union members benefit from the lower prices from import competition.
via Why Are Unions So Focused on Fighting Trade Deals? – Washington Wire – WSJ.
Far Left Mana Movement admits it’s really cheap to feed the kids
23 Mar 2015 Leave a comment
in applied welfare economics, labour economics, politics - New Zealand, poverty and inequality, welfare reform Tags: activists, child poverty, Leftover Left, school breakfast programmes
Joe Trinder, the Mana News editor, today blogged about the great expense of feeding the kids for ordinary families. In the course of doing so, he showed how extremely cheap it was for parents to make their children breakfast. The Far Left has inadvertently capitulated on school breakfast programmes been outside the reach of ordinary families.

I completely agree with Joe. A 1 kg box of Weet-Bix costs $7 and a 2 L bottle of milk costs $5.55. I buy the cheaper brands of Weet-Bix than this myself.
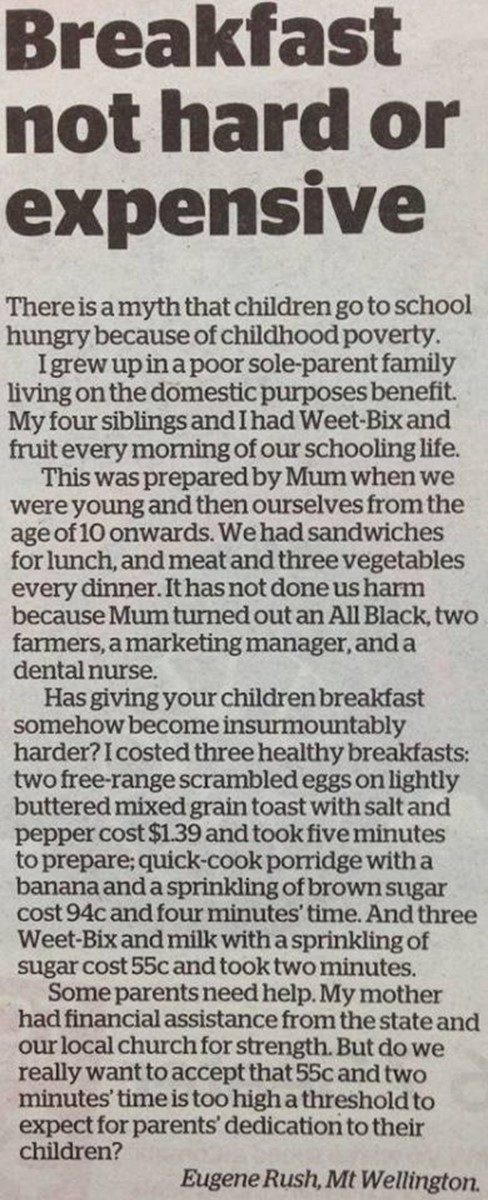
1 kg box of Weet-Bix will last maybe two weeks. 2 L of milk will last not much less than that if you pour the milk on Weet-Bix to the extent I do. Two weeks breakfast will cost much less than one dollar per breakfast as argued by Eugene Rush in her letter to the editor a few months ago.
If a family can’t find $.55 to make their children breakfast, they need targeted specific intervention from Work and Income New Zealand to see what additional financial assistance they need, including budget advice, and from the child protection agency, Child, Youth and Families.
- Providing a hungry child with breakfast at school through a Feed the Kids Bill is parliamentary grandstanding that doesn’t strike at the root of the problem.
- These hungry children are not provided with breakfast either at the weekend or during the school holidays. They are abandoned by the process set up under the Feed the Kids Bill championed by the hard left.
- Worst of all, what about the parents? No good parent would have breakfast while their child goes hungry.
No provision is made by the hard left in its Feed the Kids Bill to feed the parents of these hungry children who also go hungry every morning. There is no other charitable explanation as to why their children were not given breakfast. No one in the house can afford breakfast both during school days, at the weekend and in school holidays.
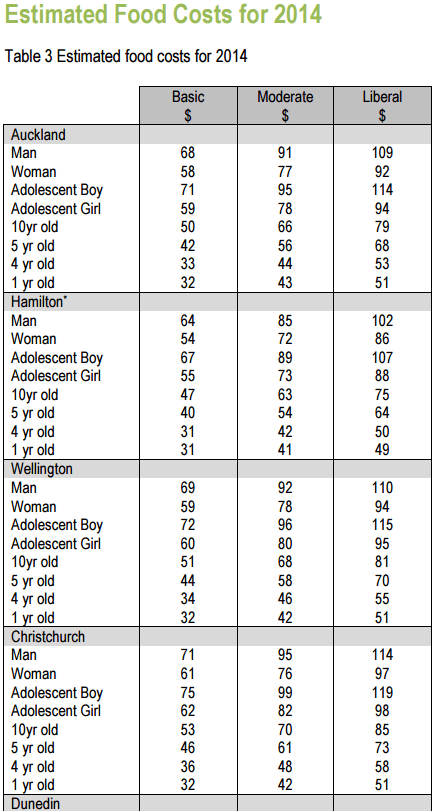
As shown from the screenshot above, the Otago University’s annual Food Cost Survey suggests that to meet basic needs, a family must spend $44 per week for a five-year-old and $34 per week for a four-year-old in Wellington, which is where I live. That is, it costs about five or six dollars per day per child to feed them. A liberal diet for a small child for a day costs not much more than a cup of coffee at a cafe where I’m going shortly. The real issue is the income of parents.
The best solution to poverty is to move people into a job. Simon Chapple is quite clear in his book in the middle of last year with Jonathan Boston that a sole parent in full-time work, and a two parent family with one earner with one full-time and one part-time worker, even at low wages, will earn enough to lift their children above most poverty thresholds.
Sustained full-time employment of sole parents and the fulltime and part-time employment of two parents, even at low wages, are sufficient to pull the majority of children above most poverty lines, given the various existing tax credits and family supports.
The best available analysis, the most credible analysis, the most independent analysis in New Zealand or anywhere else in the world that having a job and marrying the father of your child is the secret to escaping poverty is recently by the Living Wage movement in New Zealand.
According to the calculations of the Living Wage movement, earning only $18.80 per hour with a second earner working only 20 hours per week affords their two children, including a teenager, Sky TV, pets, international travel, video games and 10 hours childcare. This analysis of the Living Wage movement shows that finishing school so your job pays something reasonable and marrying the father of your child affords a comfortable family life.
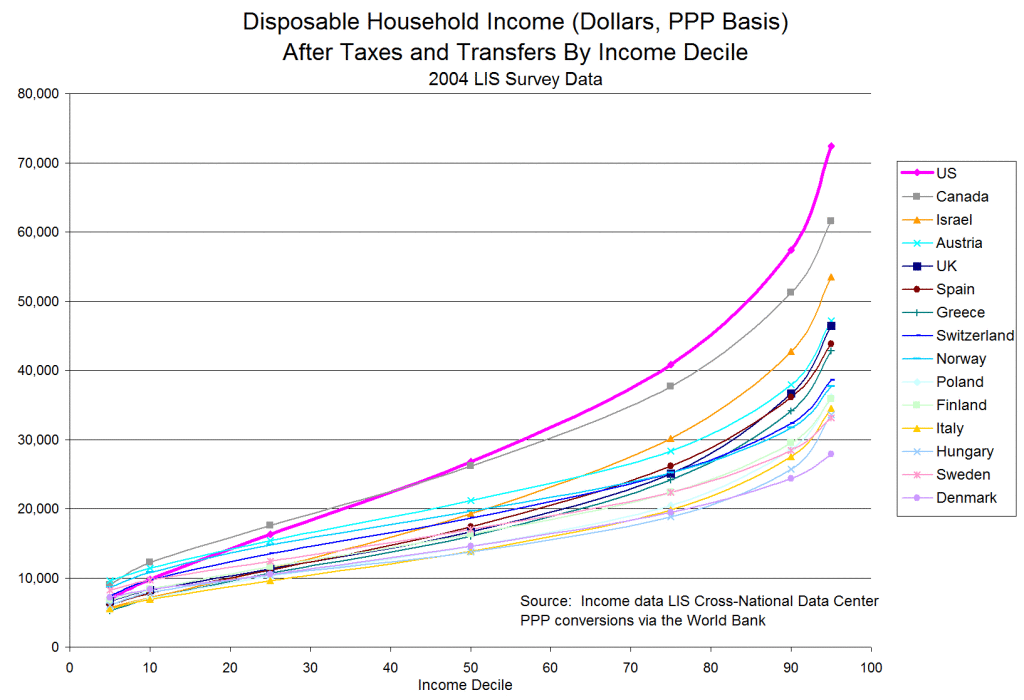
The US model does better for at least 85%, and in many cases 90%+
21 Mar 2015 Leave a comment
in politics - USA, population economics, poverty and inequality Tags: living standards, poverty and inequality
Sorry @WJRosenbergCTU the class war has been based on a measurement error! The real class enemy is the RMA and restricted land supply – updated again
21 Mar 2015 Leave a comment
in applied welfare economics, comparative institutional analysis, Marxist economics, politics - Australia, politics - New Zealand, politics - USA, poverty and inequality, urban economics Tags: Class war, Generation Rent, housing affordability, housing prices, land use regulation, RMA, Thomas Picketty, top 1%, wage stagnation
The other day, I replied to a rant by Bill Rosenberg about the decline in labour share of national income and its implications for income inequality and the great wage stagnation. The labour share of national income has dropped by at least 5% in most countries including New Zealand.

New data from the USA has found that the entire declining the value of the share of labour of national income is due to home ownership:
…the net capital share has increased since 1948, but when disaggregated this increase comes entirely from the housing sector: the contribution to net capital income from all other sectors has been zero or slightly negative, as the fall and rise have offset each other.
The capital share is rising because of the increased value of housing in countries with widespread home ownership. The concentration of capital ownership and wealth in the top 1% was a misplaced concern based on measurement error.
https://twitter.com/EconBizFin/status/581047721836060672
Piketty assumed the returns to capital were increasing across the entire economy. Rognlie found the trend to be almost entirely isolated to the housing sector. His 23 page long conference paper at the Brookings Institution started as a comment on a blog post on Marginal Revolution.

When Rognlie adjusted for the rapid depreciation inherent to investments in capital such as computer software, most of the rest of the increase in the capital share in recent decades in the USA and six other countries has came in housing.

A single sector such as housing is not the force that is shaping past and future of inequality as Piketty and others such as Bill Rosenberg in New Zealand have assumed. They attributed a growing share of income going to capital across the board as Tyler Cowan explains.
In the simplest version of the Piketty model, wealth grows more quickly than does the economy as a whole and thus the picture changes. The relative losers are no longer low earners but rather anyone who is not a capitalist. Any disparity is due not to their shortcomings in labour markets but rather to their lack of a high initial endowment.
The main driver of inequality is the tendency of returns on capital to exceed the rate of economic growth and company shares, businesses and other capital are owned by a narrow section of the community, and in particular by the top 1% of income earners. Trends in housing prices and the comings and goings of intangible capital is not part of that story.

Investment and depreciation of software and other intellectual property is not well handed, or even well measured in current national accounting systems as Edward Prescott has shown in a long research programme dating back 10 years. Intangible capital produced and owned by businesses is known to be big part of all investment in the economy but nearly all of it is recorded as an expense and therefore most is not part of GDP as currently measured.
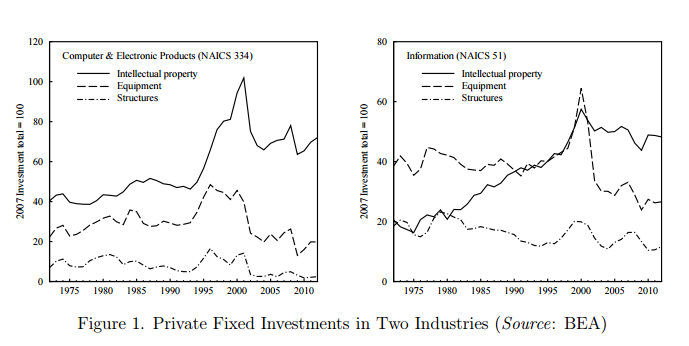
Source: Edward C. Prescott and Ellen R. McGrattan (2014)
Prescott estimated the value of intangible capital to be equal to about 60% of that of tangible capital in the US economy. Incorrect treatment of investment in intangible capital seriously underestimates investment, output, fluctuations in labour productivity and movements in the capital shares. The graph above shows that the recently introduced intellectual property classification in the US national accounts is both large and volatile relative to equipment and structures investments over the last 40 years. The graph below shows that including intangible capital completely changes the predictions of real business cycle models about trend US labour productivity in the 1990s.
Labor Productivity, for the Model, With and Without Intangible Investment (Real, Detrended) 1990-2003
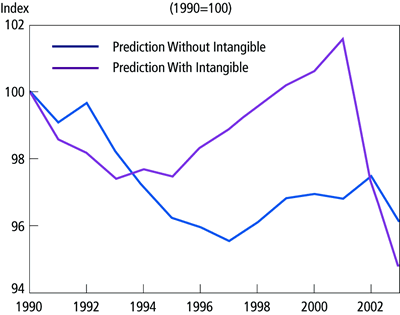
Source: McGrattan and Prescott, 2005, “Expensed and Sweat Equity,” Research Department Working Paper 636, Federal Reserve Bank of Minneapolis.
This depreciation adjustment for software investment is important because you can’t eat depreciation, as a shrewd observer noted. The rapid depreciation of software is depreciation – it cannot be redistributed from the top 1% to the downtrodden workers as some sort of income. Others have also earlier argued that Piketty’s claims rest on the recent increase in the price of housing.

The main reason for increases in the price of housing in New Zealand and elsewhere is restrictions on the supply of land by local councils. They are the real class enemy.

The metropolitan urban limit in Auckland increases land prices by 9 fold just inside that limit. As Tim Taylor said today:
The rise in capital income as a result of a long-term rise in land and housing prices across the high-income countries is a phenomenon that isn’t easily crammed into the usual disputes over whether capital owners are exploiting wage-earners.
The role of the housing sector and restrictions on land supply driving up housing prices in recent decades in shaping the future of inequality is perhaps underplayed given the many discussions of Generation Rent.

Housing affordability is a real crisis in New Zealand and many other countries with the younger generation no longer able to buy a house. They are condemned to decades of renting a house. They may never be able to afford a house on one income and perhaps two ordinary comes.
The future of inequality is between those who can and cannot afford a dream and a right for their parents and grandparents, which was to buy a house and pay the mortgage off within a couple of decades.

Young people used to buy a house shortly after leaving university and paid it off by their middle age when I was in my 20s and 30s. Back then, which was not all that long ago, ordinary workers could aspire to take out a mortgage and buy a house in the suburbs.

Unless there is a major deregulation of the supply of land in the big cities, home ownership for most in the community will really be a dream, rather than a dream of aspiration achieved by most by their 30s, if not often earlier through working and saving. The grandchildren of the baby boomers will become and perhaps already are Generation Rent.
The mummy penalty in the labour market
21 Mar 2015 Leave a comment
in discrimination, gender, labour economics, occupational choice, politics - USA, poverty and inequality Tags: gender wage gap

The reversing gender gap
19 Mar 2015 Leave a comment
in discrimination, gender, human capital, labour economics, labour supply, occupational choice, poverty and inequality, welfare reform Tags: gender wage, reversing gender gap, sex discrimination
Single parenthood in the USA by ethnicity
18 Mar 2015 1 Comment
in economics of love and marriage, gender, labour economics, occupational choice, poverty and inequality, welfare reform Tags: child poverty, economics of fertility, single parenthood, single parents

Down and out in America in 2005 – Air Conditioning, Cable TV, and an Xbox
17 Mar 2015 Leave a comment
in politics - USA, population economics, poverty and inequality Tags: living standards, poverty and inequality, The Great Enrichment
For decades, the U.S. Census Bureau has reported that over 30 million Americans were living in “poverty,” but the bureau’s definition of poverty differs widely from that held by most Americans.
In fact, other government surveys show that most of the persons whom the government defines as “in poverty” are not poor in any ordinary sense of the term. The overwhelming majority of the poor have air conditioning, cable TV, and a host of other modern amenities. They are well housed, have an adequate and reasonably steady supply of food, and have met their other basic needs, including medical care.
Some poor Americans do experience significant hardships, including temporary food shortages or inadequate housing, but these individuals are a minority within the overall poverty population.


 Utopia, you are standing in it!

Recent Comments