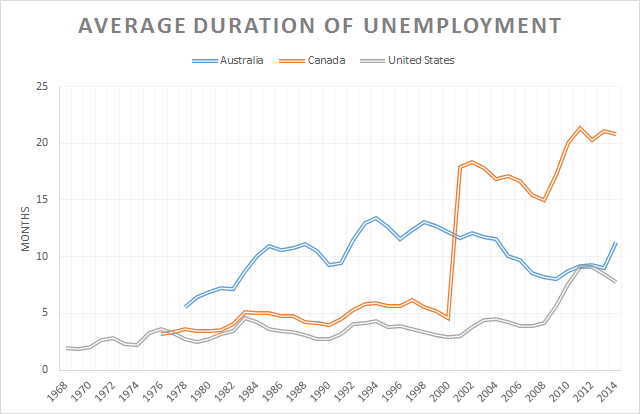
Source: OECD StatExtract.
I have no information as to why there is a sudden surge in the Canadian unemployment duration rate in 2001.
Celebrating humanity's flourishing through the spread of capitalism and the rule of law
08 Aug 2015 Leave a comment
in business cycles, economic history, global financial crisis (GFC), great recession, job search and matching, labour economics, labour supply, macroeconomics, unemployment Tags: Australia, Canada, unemployment rates
Source: OECD StatExtract.
I have no information as to why there is a sudden surge in the Canadian unemployment duration rate in 2001.
05 Aug 2015 1 Comment

#Greece austerity gauge. Greek government spending has fallen 20% since 2008. In UK and Italy it's up. #GreekCrisis http://t.co/WMQBxxVFqq—
RBS Economics (@RBS_Economics) July 07, 2015
One measure of the scale of austerity in Greece…and other advanced economies. http://t.co/PxCLagdd3L—
RBS Economics (@RBS_Economics) July 06, 2015
The employment level in #Greece is back to where it was in 1985. It's the equivalent of the UK losing 6 million jobs. http://t.co/AAWHMEFwfK—
RBS Economics (@RBS_Economics) July 06, 2015
03 Aug 2015 Leave a comment
in budget deficits, business cycles, currency unions, economic growth, Euro crisis, fiscal policy, global financial crisis (GFC), great depression, great recession, history of economic thought, law and economics, macroeconomics, monetary economics Tags: bank panics, bank runs, banking crises, currency crises, Thomas Sargent
02 Aug 2015 Leave a comment
in business cycles, F.A. Hayek, great depression, Ludwig von Mises, macroeconomics Tags: Austrian business cycle theory, forecasting errors
02 Aug 2015 Leave a comment
in budget deficits, business cycles, economic growth, fiscal policy, global financial crisis (GFC), great recession, history of economic thought, macroeconomics, monetarism, monetary economics Tags: Brad Delong, fiscal multiplier, fiscal stimulus, Larry Summers, New Keynesian macroeconomics, Thomas Sargent
31 Jul 2015 1 Comment
in business cycles, currency unions, economic growth, economic history, Euro crisis, global financial crisis (GFC), macroeconomics Tags: Eurosclerosis, Greece, Italy, sovereign defaults
30 Jul 2015 Leave a comment
in business cycles, currency unions, economic growth, Euro crisis, job search and matching, labour economics, labour supply, macroeconomics, unemployment Tags: employment law, employment regulation, EU, Euro sclerosis, Euroland, Eurosclerosis, Japan, labour market regulation
25 Jul 2015 Leave a comment
in budget deficits, business cycles, currency unions, economic growth, Euro crisis, fiscal policy, global financial crisis (GFC), international economics, law and economics, macroeconomics, monetary economics, property rights Tags: capital controls, capital flight, Greece, labour exodus, sovereign defaults
For down and out Greeks, the U.K. is the promised land with jobs aplenty bloom.bg/1Lwcc55 http://t.co/XHHXxdTUiN—
Bloomberg Business (@business) July 24, 2015
24 Jul 2015 Leave a comment
in business cycles, econometerics, economic growth, economic history, job search and matching, labour economics, labour supply, macroeconomics, politics - New Zealand, Public Choice, unemployment, unions, welfare reform Tags: antimarket bias, Don Brash, economic reform, expressive voting, Homer Simpson, Leftover Left, lost decades, makework bias, neoliberalism, rational ignorance, rational irrationality, Sir Roger Douglas, Twitter left
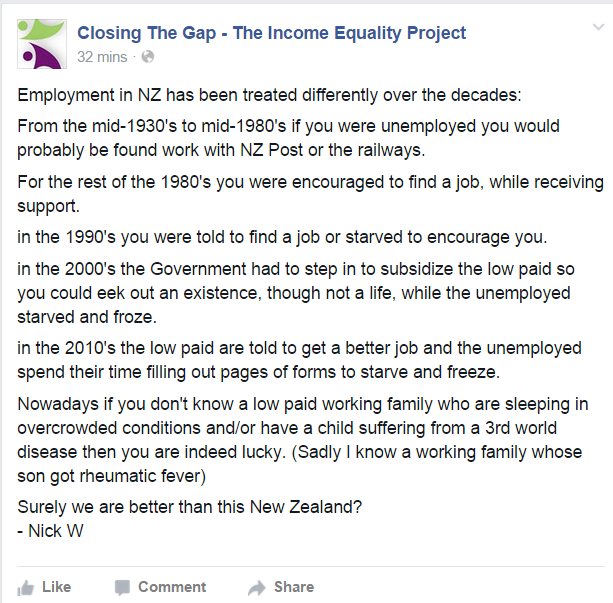
Today, Closing The Gap – The Income Inequality Project boldly claimed today that there was next to no unemployment in New Zealand prior to the onset of the curse of neoliberalism.
There is an Internet on computers now where it is easy to find data showing that the unemployment rate was rising rapidly in New Zealand in the 1970s and in double digits by the end of the 1980s – see figure 1.
Figure 1: harmonised unemployment rates, Australia and New Zealand, 1956-2014
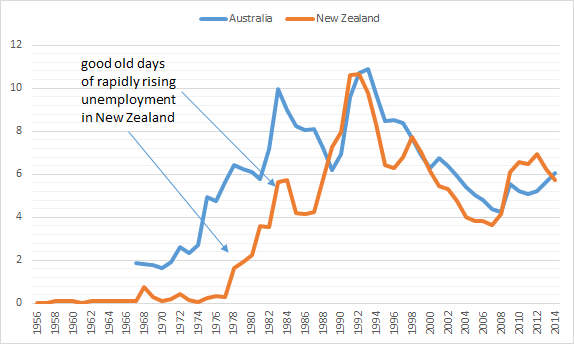
Source: OECD StatExtract.
Figure 1 shows unemployment was rising rapidly in the 1970s and wasn’t much different by the end of the 1970s to the unemployment rates recorded after about 2000 in New Zealand.

One of the reasons that Sir Roger Douglas wrote There’s Got To Be A Better Way was the rapidly rising unemployment in New Zealand and the stagnant economic growth in the late 1970s and early 1980s.

New Zealand was one of the most regulated economies, so much so that Prime Minister David Lange said:
We ended up being run very similarly to a Polish shipyard.
As for those jobs on the railways, the then Reserve Bank Governor Don Brash said in 1996:
Railways cut its freight rates by 50 percent in real terms between 1983 and 1990, reduced its staff by 60 percent, and made an operating profit in 1989/90, the first for six years.
More on unemployment: In 1955 the New Zealand’s prime minister knew all unemployed personally.
– Atkinson’s new book http://t.co/x37Vxya97C—
Max Roser (@MaxCRoser) July 24, 2015
24 Jul 2015 Leave a comment
in business cycles, currency unions, economic growth, Euro crisis, global financial crisis (GFC), macroeconomics Tags: Euro land, Finland, recessions and recoveries, Sweden
23 Jul 2015 Leave a comment
in business cycles, economic history, economics of regulation, great depression, industrial organisation, labour economics, macroeconomics, unions Tags: Herbert Hoover, Lee Ohanian
21 Jul 2015 Leave a comment
in business cycles, economics of education, global financial crisis (GFC), great recession, human capital, job search and matching, labour economics, labour supply, macroeconomics, unemployment Tags: education premium, labour market demographics
June jobless rate for people 25+ with
B.A. or more 2.5%
High school diploma 5.4%
No H.S. 8.2%
on.wsj.com/1LG1B6z http://t.co/luUUuw9h1V—
Sudeep Reddy (@Reddy) July 02, 2015
19 Jul 2015 Leave a comment
in business cycles, economic growth, economic history, fiscal policy, job search and matching, labour economics, macroeconomics, unemployment Tags: Celtic Tiger, equilibrium unemployment rate, Eurosclerosis, Germany, Ireland, Italy, natural unemployment rate, Rance, Spain
Figure 1 shows large contrasts in time path of equilibrium unemployment rates. For example, French and Italian equilibrium unemployment rates haven’t changed much since about 1986.
Figure 1: equilibrium unemployment rates, France, Germany, Italy, Ireland and Spain, 1968 – 2016
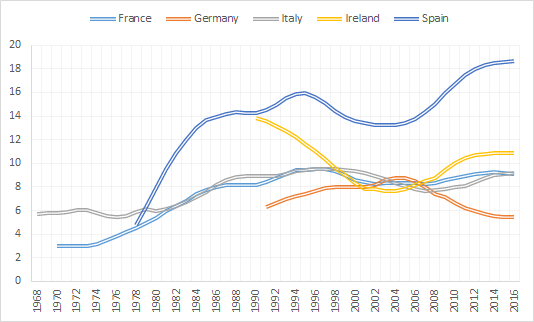
Source: OECD Economic Outlook June 2015 via OECD StatExtract..
Figure 1 also shows some fortuitous ups and downs in the German equilibrium unemployment rate. This estimate was available only from after German unification.
The equilibrium German unemployment rate rose from 6% to above 8% on the eve of the global financial crisis. Fortunately for Germany, major labour market reforms brought the equilibrium unemployment rate down as Germany moved into the global financial crisis.
The Spanish equilibrium unemployment rate had been terrible since about 1980, started to fall in the 1990s, then skyrocketed even before the onset of the global financial crisis – see figure 1.
There have been ups and downs in the Irish equilibrium unemployment rate – see figure 1. It was as high as 14% at the end of the Irish great depression of the 1970s and 1980s. The equilibrium Irish unemployment rate was 8% at the heyday of the Celtic tiger then slowly rose in the lead up to the global financial crisis.
18 Jul 2015 Leave a comment
in business cycles, job search and matching, labour economics, labour supply, macroeconomics, unemployment Tags: British economy, Canada, equilibrium unemployment rate, natural unemployment rate
Figure 1 suggests a lot more structural change in the Canadian and British labour market in the 1970s and 1980s.
Figure 1: equilibrium unemployment rates, Canada, USA and UK, 1962 – 2016
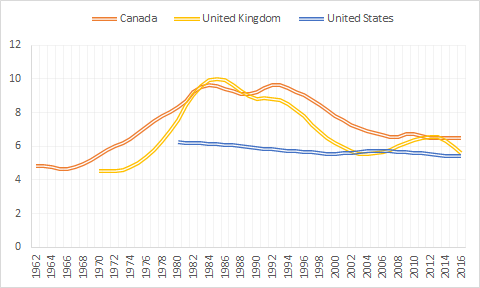
Source: OECD Economic Outlook June 2015 via OECD StatExtract.
Nothing much at all seems to have happened to the equilibrium unemployment rate in the USA since the OECD first started calculating it. I doubt that so that will be subject of a future blog. Namely, the large changes in natural unemployment rates in the post-war period, largely to demographic changes such as the baby boom.
Celebrating humanity's flourishing through the spread of capitalism and the rule of law
Celebrating humanity's flourishing through the spread of capitalism and the rule of law
Celebrating humanity's flourishing through the spread of capitalism and the rule of law
Celebrating humanity's flourishing through the spread of capitalism and the rule of law
Celebrating humanity's flourishing through the spread of capitalism and the rule of law
Celebrating humanity's flourishing through the spread of capitalism and the rule of law
Celebrating humanity's flourishing through the spread of capitalism and the rule of law
Celebrating humanity's flourishing through the spread of capitalism and the rule of law
A History of the Alt-Right
Econ Prof at George Mason University, Economic Historian, Québécois
Celebrating humanity's flourishing through the spread of capitalism and the rule of law
Scholarly commentary on law, economics, and more
Beatrice Cherrier's blog
Celebrating humanity's flourishing through the spread of capitalism and the rule of law
Celebrating humanity's flourishing through the spread of capitalism and the rule of law
Celebrating humanity's flourishing through the spread of capitalism and the rule of law
Why Evolution is True is a blog written by Jerry Coyne, centered on evolution and biology but also dealing with diverse topics like politics, culture, and cats.
Celebrating humanity's flourishing through the spread of capitalism and the rule of law
A rural perspective with a blue tint by Ele Ludemann
DPF's Kiwiblog - Fomenting Happy Mischief since 2003
Celebrating humanity's flourishing through the spread of capitalism and the rule of law
The world's most viewed site on global warming and climate change
Tim Harding's writings on rationality, informal logic and skepticism
A window into Doc Freiberger's library
Let's examine hard decisions!
Commentary on monetary policy in the spirit of R. G. Hawtrey
Thoughts on public policy and the media
Celebrating humanity's flourishing through the spread of capitalism and the rule of law
Politics and the economy
A blog (primarily) on Canadian and Commonwealth political history and institutions
Reading between the lines, and underneath the hype.
Economics, and such stuff as dreams are made on
"The British constitution has always been puzzling, and always will be." --Queen Elizabeth II
Celebrating humanity's flourishing through the spread of capitalism and the rule of law
Celebrating humanity's flourishing through the spread of capitalism and the rule of law
WORLD WAR II, MUSIC, HISTORY, HOLOCAUST
Undisciplined scholar, recovering academic
Celebrating humanity's flourishing through the spread of capitalism and the rule of law
Res ipsa loquitur - The thing itself speaks
In Hume’s spirit, I will attempt to serve as an ambassador from my world of economics, and help in “finding topics of conversation fit for the entertainment of rational creatures.”
Researching the House of Commons, 1832-1868
Articles and research from the History of Parliament Trust
Reflections on books and art
Posts on the History of Law, Crime, and Justice
Celebrating humanity's flourishing through the spread of capitalism and the rule of law
Exploring the Monarchs of Europe


Recent Comments