
Celebrating humanity's flourishing through the spread of capitalism and the rule of law
22 Dec 2014 Leave a comment
in applied price theory, comparative institutional analysis, constitutional political economy, economics of bureaucracy, Marxist economics, Public Choice Tags: Brad De Long, Leftover Left, Social Democrats
21 Dec 2014 Leave a comment
in development economics, growth disasters, growth miracles, Marxist economics Tags: Cuba, The Great Enrichment
19 Dec 2014 Leave a comment
in liberalism, Marxist economics Tags: Cuba, Fidel Castro, Leftover Left, The Great Enrichment, The Great Fact
15 Dec 2014 Leave a comment
in economic history, income redistribution, labour economics, Marxist economics, politics - USA, technological progress Tags: Bryce Edwards, Leftover Left, poverty and inequality
Bryce Edwards has shown in today’s column that he knows nothing about inequality in New Zealand, despite the statistics being at his fingertips:
Under capitalism there’s always going to be a war against the poor.
The process by which we divide up the resources of any society normally involves exploiting the majority for the benefit of the minority.
It’s called inequality. And this is how it is in New Zealand: those who have the most power look for ways to extract that money for themselves, or at least retain the status quo.
Against this are those who want to have a more equal society. It’s an age-old political issue, and one that has traditionally been at the heart of the left-right political divide.
In 2014 this concern about inequality has been a key feature of politics, underpinning much of what has occur…
Although the rich appear to have been winning for three decades in their ‘war against the poor’, perhaps the tide is turning?
There’s still every indication of severe poverty and inequality in this country.
Firstly, inequality has not increased in New Zealand for at least 20 years when either measured in figure 1 by the Gini coefficient or in figure 2, the top 1% income shares. Both the Gini coefficient and the top 1% income shares have not risen for 20 years.
Figure 1: Gini coefficient New Zealand 1980-2015

Source: Bryan Perry, Household incomes in New Zealand: Trends in indicators of inequality and hardship 1982 to 2013. Ministry of Social Development (July 2014).
Figure 2: Top 1% income shares, USA, New Zealand and Australia, 1970-2012
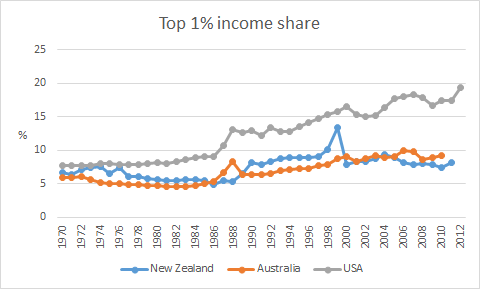
Source: top incomes database
Secondly, the benefits of the economic boom that lasted 15 years from the early 1990s until the onset of the global financial crisis would spread broadly across all sections of the New Zealand community. As shown in figure 3, both before and after housing costs increased. As shown in figure 4, real household incomes increased pretty much evenly across all of the 10 income deciles between 1994 and 2013.
Figure 3: Real household income trends before housing costs (BHC) and after housing costs (AHC), 1982 to 2013 ($2013)
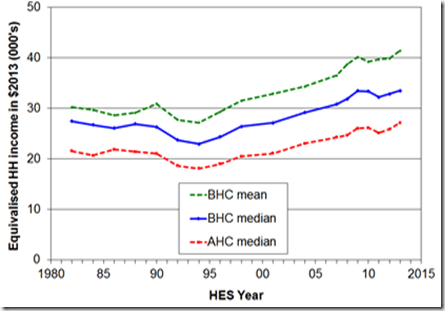
Source: Bryan Perry, Household incomes in New Zealand: Trends in indicators of inequality and hardship 1982 to 2013. Ministry of Social Development (July 2014).
Figure 4: Real household incomes (BHC), changes for top of income deciles, 1994 to 2013
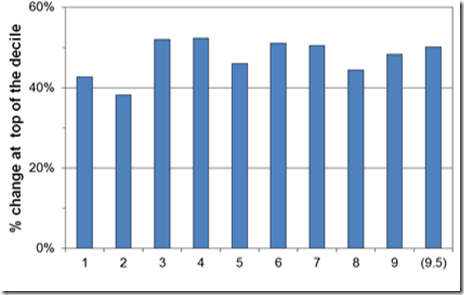
Source: Bryan Perry, Household incomes in New Zealand: Trends in indicators of inequality and hardship 1982 to 2013. Ministry of Social Development (July 2014).
Thirdly, as shown in figure 5, between 1994 and 2010, real equivalised median household income rose 47% from 1994 to 2010; for Māori, this rise was 68%; for Pasifika, the rise was 77%. Median household income increases of nearly 50% in 16 years should be celebrated.
Figure 5: Real equivalised median household income (before housing costs) by ethnicity, 1988 to 2013 ($2013).

Source: Bryan Perry, Household incomes in New Zealand: Trends in indicators of inequality and hardship 1982 to 2013. Ministry of Social Development (July 2014).
The massive improvements in Māori incomes since 1992 were based on rising Māori employment rates, fewer Māori on benefits, more Māori moving into higher paying jobs, and greater Māori educational attainment. Māori unemployment reached a 20-year low of 8 per cent from 2005 to 2008.
Over the last more than two decades in New Zealand, there has been sustained income growth spread across all of New Zealand society contrary to the warmed over Marxism of Bryce Edwards. Perry (2014) reviews the data every year for the Ministry of Social Development. He concluded that:
Overall, there is no evidence of any sustained rise or fall in inequality in the last two decades.
The level of household disposable income inequality in New Zealand is a little above the OECD median.
The share of total income received by the top 1% of individuals is at the low end of the OECD rankings.
Bryce Edwards’ analysis was in the typical Marxist tradition – it had no gender analysis. He failed to mention that New Zealand has the smallest gender wage gap of all the industrialised countries.

As he did not notice these great successes in household incomes, incomes of every decile, Māori economic development and the empowerment of women, Bryce Edwards had nothing to add in terms of either consolidating or improving on them.
06 Dec 2014 Leave a comment
in environmental economics, global warming, Marxist economics Tags: climate alarmism, green rent seeking, low carbon economy, Robert Murphy
02 Dec 2014 Leave a comment
in applied price theory, labour economics, labour supply, managerial economics, Marxist economics, organisational economics, personnel economics, politics - New Zealand, unions Tags: fixed cost of employment, fixed costs of working, inherent inequality of bargaining power between workers and employers, reserve army of the unemployed, The pretence to knowledge, zero hours contracts
The Unite Union, which represents about 7000 workers across New Zealand, has announced a campaign against zero-hours contracts. Zero-hours contracts have no specified hours or times of work so a worker could end up working 40 hours one week and none the next.
Unite national director Mike Treen did not know of the specific numbers of such contracts, but said these contracts were particularly common in the fast food industry, although they also appeared in some other industries.
Unite Union’s national director said that zero hours contracts made workers vulnerable to abuse as they became too nervous to speak out, for fear of having their hours reduced.
There’s no security and it puts enormous power in the hands of managers. People are extremely reluctant to assert their rights for simple things like breaks…
Treen admitted that zero-hours contracts gave employers flexibility, but pretended to know that the amount of flexibility employers actually needed was often exaggerated.
It’s not like they have huge swings or anything. They know how much they are going to sell on any particular day of the week during the year… We don’t expect everybody to have guaranteed hours but 80 per cent of the crew should be able to have it.
Treen said the union was not planning to push for a law change at this stage and would focus on addressing the issue during negotiations with fast food companies early next year.
The new leader of the opposition has promised to outlaw these zero our contracts when he gets into government. I wish him well in drafting a law that outlaws zero-hours contracts without outlawing some part-time and casual jobs as well.
Zero-hours contracts and the class war
As is to be expected, the Guardian is rather hot and bothered about zero hours contracts. One of its columnists referred to those on zero-hours contracts as the new reserve army of the unemployed:
It is a pity Karl Marx was not around last week to comment on the news that 90% of the workers at Sports Direct are on zero-hours contracts.
The author of the Communist Manifesto would also have had plenty to say about the news that the official estimates of those working in this form of casualised labour had shot up by 25%…
It is safe to say Marx would have cavilled with those who see zero-hour contracts as an expression of Britain’s economic strength, a demonstration of flexible labour markets in action.
He would have thought "reserve army of labour" a better description of conditions in which workers were expected to be permanently on call for an employer.
The Guardian went on to admit that the reserve army of unemployed are not as discontented as they should be:
It’s only fair to say that some employees are content to be on zero-hours contracts.
Some students, for example, want to combine work with study and are willing to turn up when summoned. That’s also true of older workers topping up their pensions with a bit of irregular, part-time work.
Despite this, the class war continues as does the immiseration of the proletariat and the long-term decline in profits that will lead to the crisis in capitalism and, with a bit of luck, the inevitable proletarian revolution:
Marx would have seen zero-hours contracts as the continuation of a long historical trend, stretching back to the mid-1960s when the profitability of western manufacturing firms started to fall.
From that moment, he would say, the search was on for measures to boost profits, and this has manifested itself in a number of ways: by direct attacks on organised labour; by the increased financialisation of the economy; by the search for cheap raw materials whatever the environmental cost; and by asset bubbles.
Accordingly, zero-hours contracts are the response to tougher conditions facing firms as a result of the financial crisis.
Reversing that trend will require more than legislation: it will mean tackling one of the root causes of that crisis: the imbalance of power in the labour market.
A more mellow writer in the Guardian brought up the imagery of the interwar depression:
Of course it is difficult for employers to match the demand to work nine to five and yet also to be served on a 24-hour basis, cheaply and effectively by someone, not them.
But there are other ways to solve this conundrum than indenturing workers or making them wait at the metaphorical factory gate for a tap on the shoulder.
The fixed costs of working
I will start my third blog on the economics of zero-hours by reviewing the economic literature on the fixed costs of working. Helpfully, this literature predicts that zero hours contracts really shouldn’t exist much at all.
The literature on the economics of the fixed costs of work arose out of the economics of retirement and the economics of the labour supply of married women, and in particular of young mothers. This literature was attempting to explain why older workers, or young mothers either worked a minimum number of hours, or not at all.
Fixed costs of working constrain the choices that older employees make about how many hours and days that are worthwhile working part-time. For employees, the fixed costs of going to work limit the numbers of days and number of hours per day that a worker is willing to work part-time. The timing costs of working at scheduled times and a fixed number of days per week can make working fewer full-time days, rather than fewer hours per day less disruptive to the leisure and other uses of personal time.
The fixed costs of working induced older workers to retire completely, and young mothers to withdraw from the workforce for extended periods of time, unless these workers worked either full-time or enough hours part-time each day and through the week to justify the costs of commuting and otherwise disrupting their day and week.
In the case of older workers, there were the fixed costs of commuting and other disruptions to their day. In the case of mothers, there are additional fixed costs of working arising from child care and the commuting and other rather rigid time commitments of picking up and dropping off younger children at school and to day care centres.
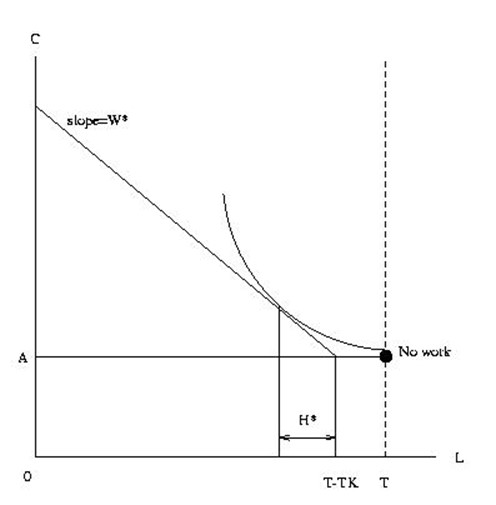
The fixed costs of going to work
There is a minimum number of hours of work that will be supplied by different workers that is set by the fixed costs of working. These fixed costs of work arise from commuting time and from dressing and other tasks involved in preparing for the trip to work. These costs are fixed because they do not vary with the number of hours to be worked per day and the amount of effort to be exerted while working (Cogan 1981; Hamermesh and Donald 2007).
A worker will not accept a job offer or continue in a particular job unless they work sufficient hours so that these fixed costs of going to work are recovered along with receiving sufficient reward for giving up pursuing other job openings open now and in the future and for forgoing leisure and the option of making other uses of their time (Cogan 1981; Hamermesh and Donald 2007).
Cogan (1981) estimated that the average fixed time and money costs of married women entering the workforce was 28 per cent of their earnings, and also estimated that the minimum number of hours a married woman was willing to supply in the labour market was 1,300 hours per year.
There may be a preference for fewer working days over fewer hours per day to reduce the time and money costs of going to work. Donald and Hamermesh (2009) estimated that fixed costs of going to work are equal to about 8 per cent of income. The fixed costs of working provide an incentive to workers to bunch activities.
The fixed timing costs of labour market entry
A surprisingly large part of the fixed costs of working comes from disruption in the ability to use spare time effectively (Donald and Hamermesh 2009, 2007). Entering or remaining in the workforce for any time at all significantly affects the effective allocation and enjoyment of time outside of working hours. This disruption to the effective use of the time that is left outside of working hours is the fixed timing cost of labour market entry.
One way to reduce this disruption from entering the labour force at all is to seek to reduce the number of days worked per week rather than the number of hours per day.
Leisure and other private uses of time are displaced if the individual takes or stays in even a small part-time job. Workers must use their reduced amount of remaining free time to catch-up on tasks, often at the weekend that they could have done if they were not working.
Leisure time may be the first to go because many personal tasks can be rescheduled but must be done eventually. These range from cooking, eating, and cleaning to personal upkeep, sleep and rest. Tasks must be hurried or done to a lower quality (Donald and Hamermesh 2009).
Routine – having the same schedule from day to day – saves time (Hamermesh 2005). Routine enables people to economise on the set-up costs of consumption, leisure and going to work.
Entering the work-force for any time at all to work even a small number of hours per day or per week calls for new daily and weekly routines and disrupts many existing routines that make better use of leisure, family and other uses of time (Hamermesh 2005).
Entering the workforce constrains the unfettered use of spare time. Working increases the fixed costs of coordinating family and leisure times. Workers must surround working times with buffers to ensure they are not late for work.
One reality of rising incomes is time become more valuable. A rise in wages raises the value of time because time is a finite and irreplaceable resource. Time cannot be stored or bought and sold but people can try and make better use of it.
With only 24 hours still in every day, the cost of time-intensive activities including working will rise as incomes increase. People shift away from time intensive activities and buy more of those products that are time saving or which are less time intensive to consume. Time is money and this maxim applies with greater resonance as incomes and wealth increase.
Another important fixed time costs of labour market entry is its impact on the efficiency of the remaining time devoted to leisure, household production and other activities when even a small amount of market work is undertaken. Spare time is of much less value if part of every day is to be spent at work.
Fixed timing costs arise because of a need to hurry to get to work on time and forego other activities to be rested for work the next morning. The requirement to attend work blocks out certain days from major other uses of that day and reduces the time available in any day of part-day work for leisure, family time and household production.
Household production refers to the goods and services made at home which could be purchased in the market from a third-party. These include food preparation, cooking, carer obligations, and household cleaning. There are also various other household tasks that must perform for one-self which are essentially personal maintenance and leisure.
Working even a few hours can reduce the worker’s efficiency in household production and other non-market activities and may require the worker to buy goods and services that were previously produced at home. This reduces the net financial rewards of working. Fewer full days of work, rather than fewer hours per day is less disruptive to leisure and the other uses of personal time.
The fixed time costs of market work might induce workers to engage in different mixes of other activities. The additional hours of work during the week affect the allocation of time on a non-working weekend day. They reduce leisure time on weekends and increase weekend time devoted to household production by those who do market work on week days. Workers catch up at the weekend on the household production that the rigidities of their market work prevented them from doing during the week.
Stress is an important fixed cost of working. Workers spend non-market time worrying or thinking about work-problems. Even a few hours of market work will place a worker at risk of some stress.
Floors and ceilings on the structure of the working week
The fixed costs of going to work and the fixed time cost of labour market entry both place constraints on the willingness of workers to accept a job offer involving a zero-hours contract. These contracts must offer something extra over competing job options.
The employer must offer something extra to prospective recruits to induce them to sign a zero-hours contract. There must be something substantial to overcome both the fixed costs of work, such as commuting, and the less obvious but still substantial fixed costs of labour market entry.
Any commitment to work, such as working on a zero hours contract, carries with it significant costs in terms of disruption to the rest of the day, the rest of the working week and the amount of the weekend that is spent on leisure versus resting from work and catching up on tasks that otherwise could have been done during the week but for work commitments.
A zero-hours contract must pay enough over the expected life time of the job to make up for the costs of going to work as well as the disruption and loss of leisure time and also the pure disutility of working before the worker breaks even on working.
As the Unite Union official noted, zero hours contracts appear to be most prevalent in the fast food sector. Job turnover rates in the sector can be several hundred per cent per year.
Many of the workers in the fast food sector, as the Unite union official himself noted, are young. Teenagers and young workers changed jobs frequently, particularly those who are studying part-time or full-time work, injuring the summer.
As such, zero-hours contracts in any particular job will have a short expected life over which the teenager or young worker would have to recoup for the fixed cost of working and the fixed cost of any labour market entry. Employers would have to offer some sort of premium or other implicit guarantee of regular work to induce prospective young recruits to sign a zero hours contract.
The type of workers who will profit from signing a zero hours contracts of those workers with few other demands on their time and flexible days. The workers who might find zero hours contract appealing will be those who do have much routine in their day. Workers who have a considerable amount of routine in their day such as because of family commitments will not find the wage offers in zero hours contracts appealing.
There will be job sorting: workers who have low fixed costs of working and low fixed costs of labour market entry will be attracted to zero-hours contracts.
Employers profit from offering zero hours contracts to workers who don’t want to make a regular commitment to come into work every day. Teenagers and students fall into this category, which makes it less surprising that zero hours contracts appear to be most common in the fast food sector.
There are mutual gains in the fast food sector to both employers and workers from zero hours contracts when there are peaks and troughs in product demand, and some teenagers and young workers have a low cost of coming into work at short notice.
28 Nov 2014 Leave a comment
in liberalism, Marxist economics, politics - Australia, politics - New Zealand, politics - USA Tags: Green Left, Leftover Left, meddlesome preferences
28 Nov 2014 Leave a comment
in income redistribution, liberalism, Marxist economics, politics - USA, rentseeking Tags: corporate welfare, Occupy Wall Street, rent seeking, tea party, top 1%
Celebrating humanity's flourishing through the spread of capitalism and the rule of law
A History of the Alt-Right
Econ Prof at George Mason University, Economic Historian, Québécois
Celebrating humanity's flourishing through the spread of capitalism and the rule of law
Scholarly commentary on law, economics, and more
Beatrice Cherrier's blog
Celebrating humanity's flourishing through the spread of capitalism and the rule of law
Celebrating humanity's flourishing through the spread of capitalism and the rule of law
Celebrating humanity's flourishing through the spread of capitalism and the rule of law
Why Evolution is True is a blog written by Jerry Coyne, centered on evolution and biology but also dealing with diverse topics like politics, culture, and cats.
Celebrating humanity's flourishing through the spread of capitalism and the rule of law
A rural perspective with a blue tint by Ele Ludemann
DPF's Kiwiblog - Fomenting Happy Mischief since 2003
Celebrating humanity's flourishing through the spread of capitalism and the rule of law
The world's most viewed site on global warming and climate change
Tim Harding's writings on rationality, informal logic and skepticism
A window into Doc Freiberger's library
Let's examine hard decisions!
Commentary on monetary policy in the spirit of R. G. Hawtrey
Thoughts on public policy and the media
Celebrating humanity's flourishing through the spread of capitalism and the rule of law
Politics and the economy
A blog (primarily) on Canadian and Commonwealth political history and institutions
Reading between the lines, and underneath the hype.
Economics, and such stuff as dreams are made on
"The British constitution has always been puzzling, and always will be." --Queen Elizabeth II
Celebrating humanity's flourishing through the spread of capitalism and the rule of law
Celebrating humanity's flourishing through the spread of capitalism and the rule of law
WORLD WAR II, MUSIC, HISTORY, HOLOCAUST
Undisciplined scholar, recovering academic
Celebrating humanity's flourishing through the spread of capitalism and the rule of law
Res ipsa loquitur - The thing itself speaks
In Hume’s spirit, I will attempt to serve as an ambassador from my world of economics, and help in “finding topics of conversation fit for the entertainment of rational creatures.”
Researching the House of Commons, 1832-1868
Articles and research from the History of Parliament Trust
Reflections on books and art
Posts on the History of Law, Crime, and Justice
Celebrating humanity's flourishing through the spread of capitalism and the rule of law
Exploring the Monarchs of Europe
Cutting edge science you can dice with
Small Steps Toward A Much Better World
“We do not believe any group of men adequate enough or wise enough to operate without scrutiny or without criticism. We know that the only way to avoid error is to detect it, that the only way to detect it is to be free to inquire. We know that in secrecy error undetected will flourish and subvert”. - J Robert Oppenheimer.
The truth about the great wind power fraud - we're not here to debate the wind industry, we're here to destroy it.
Celebrating humanity's flourishing through the spread of capitalism and the rule of law
Celebrating humanity's flourishing through the spread of capitalism and the rule of law


Recent Comments