
@Income_Equality this mostly criticises @annetterongotai @AndrewLittleMP
11 Mar 2016 Leave a comment
in applied welfare economics, health economics, politics - New Zealand

Solution aversion and the anti-science Left
11 Mar 2016 1 Comment
in applied price theory, applied welfare economics, comparative institutional analysis, constitutional political economy, economics of regulation, energy economics, environmental economics, global warming, health economics, law and economics, politics - Australia, politics - New Zealand, politics - USA, property rights, Public Choice Tags: antiscience left, climate alarmism, geo-engineering, GMOs, growth of knowledge, gun control, motivated reasoning, nuclear power, political persuasion, solar power, solution aversion, wind power

Climate science is the latest manifestation of solution aversion: denying a problem because it has a costly solution. The Right does this on climate science, the Left does it on gun control, GMOs, and plenty more. Cass Sunstein explains:
It is often said that people who don’t want to solve the problem of climate change reject the underlying science, and hence don’t think there’s any problem to solve.
But consider a different possibility: Because they reject the proposed solution, they dismiss the science. If this is right, our whole picture of the politics of climate change is off.
Some psychologists wasted grant money on lab experiments to show that people that think the solution to a problem is costly tend to rubbish every aspect of the argument. Any politician will tell you you do not concede anything. Sunstein again:
Campbell and Kay asked the participants whether they agreed with the IPCC. And in both, about 80 percent of Democrats did agree; the policy solutions made no difference.
Republicans, in contrast, were far more likely to agree with the IPCC when the proposed solution didn’t involve regulatory restrictions…
Here, then, is powerful evidence that many people (of course not all) who purport to be skeptical about climate science are motivated by their hostility to costly regulation.
The Left is equally prone to motivated readings. For example, it was found that those on the left are much more concerned about home invasions when gun control can reduce them rather than increase them.

The Left picks and chooses which scientific consensus as it accepts. The overwhelming consensus among researchers is biotech crops are safe for humans and the environment. This is a conclusion that is rejected by the very environmentalist organisations that loudly insist on the policy relevance of the scientific consensus on global warming.
Previously the precautionary principle was used to introduce doubt when there was no doubt. But when climate science turned in their favour, environmentalists wanted public policy to be based on the latest science.
The Right is welcoming of the science of nuclear energy or geo-engineering. The Left rejects it point-blank. Their refusal to consider nuclear energy as a solution to global warming is a classic example of solution aversion. Let he who is without sin cast the first stone.
Monopolies and patents can breed deadweight loss and market inefficiencies
11 Mar 2016 Leave a comment
in applied price theory, applied welfare economics, comparative institutional analysis, law and economics, politics - Australia, politics - New Zealand, politics - USA, property rights Tags: intellectual monopolies, patents and copyright
% of workforce employed by large firms across the OECD
11 Mar 2016 Leave a comment
in industrial organisation, politics - New Zealand Tags: The fatal conceit, The pretense to knowledge
It is claimed that New Zealand lacks large firms, that “New Zealand has one very large firm – Fonterra – and a long tale of large to mid-sized firms”. The percentage of the workforce employed by large firms in New Zealand is in the middle of the pack. It is not in any way an outlier.

Source: Entrepreneurship at a Glance 2015 – OECD 2015.
A hurdle to cross-national comparisons of firm size distribution is the number of small firms will fall and the number of large firms will rise with increases in real wages (Lucas 1978; Poschke 2013; Gollin 2008; Eeckhout and Jovanovic 2012). Nations that are more productive than New Zealand have higher wages because they have accumulated more capital per worker. One consequence of more capital per worker is real wages increase at a faster rate than profits (Gollin 2008; Eeckhout and Jovanovic 2012). For example, the rate of return on capital was stable over the 20th century while real wages increased many fold (Jones and Romer 2010).
Higher wages reduces the supply of entrepreneurs and increases the average size of firms because entrepreneurship becomes a less attractive occupational choice (Lucas 1978; Gollin 2008; Eeckhout and Jovanovic 2012). For example, in the mid-20th century, many graduates who were not teachers were self-employed professionals. With an expanding division of labour because of economic growth, many well-paid jobs and new occupations emerged for talented people in white-collar employment.
OECD countries richer than New Zealand should have less self-employment and more firms that are large because paid employment is an increasingly better-rewarded career option for their high skilled workers. The U.S. had the second lowest share of self-employed workers (7 percent) in the OECD in 2010 – the latest data – which is less than half the rate of New Zealand self-employment (16.5 percent) in 2011 (OECD 2013). The Australian self-employment rate was 11.6 per cent in 2010 (OECD 2013).
A companion reason for larger average firm sizes in countries richer than New Zealand is more capital-intensive production can prosper in larger corporate hierarchies than can labour-intensive production (Lucas 1978; Becker and Murphy 1992; Poschke 2011; Eeckhout and Jovanovic 2012).
The more able entrepreneurs can run larger firms with bigger spans of control in richer countries because their employees can profitably use more capital per worker with less supervision. The diseconomies of scale to management and entrepreneurship should rise at a faster rate in less technological advanced countries such as New Zealand because they are more labour intensive economies (Lucas 1978; Becker and Murphy 1992; Poschke 2011; Eeckhout and Jovanovic 2012).
Importantly, the more able entrepreneurs benefit most from introducing frontier technologies because they can deal more easily with their increased complexity and more uncertain prospects (Poschke 2011; Lazear 2005; Shultz 1975; 1980). Growing technological complexity reduces the supply of entrepreneurs because it takes longer to acquire the necessary balance of skills and experience needed to lead a firm (Lazear 2005; Otani 1996).
The more marginal entrepreneurs will switch to be employees as technology advances so the average size of firms will increase. The entrepreneurs that remain in business will be the most able, more skilled and more experienced entrepreneurs and will be more capable of running larger firms that pioneer complex, frontier technologies (Poschke 2011; Lazear 2005, Otani 1996; Lucas 1978). Countries more technologically advanced than New Zealand will have both larger firms and less self-employment because of growing technological complexity.
The greater is the exposure to foreign competition, the smaller is the fraction of self-employed and small firms in a country (Melitz 2003; Díez and Ozdagli 2012). More foreign competition increases wages because of lower prices, which makes self-employment less lucrative. More exporting favours larger firms both because of the fixed costs of entering export markets and because the stiffer competition will weed-out the lower ability entrepreneurs who run the smaller firms (Melitz 2003; Díez and Ozdagli 2012). Countries that export more than New Zealand also will have larger firms.
Average firm sizes are often larger is richer countries because of their high labour productivity and higher wages rather than labour productivity is low in New Zealand because average firm sizes are smaller. Other factors can countermand the effects that occupational choice, frontier technologies, exporting and capital intensity have to increase the average size of firms as real wages rise. This makes comparisons of firm size distributions are even more fraught with institutional complexities.
Tax and regulatory policies appear to reduce the average size of firms in many EU member states to levels that are similar to New Zealand. A nuance in international comparisons of firm size distributions is the EU is less likely to have large firms in its labour intensive sectors. Employment protection laws, product market and land use regulation and in particular, high taxes stifled the growth of labour intensive services sectors in the continental EU (Bertrand and Kramatz 2002; Bassanini, Nunziata and Venn 2009; Rogerson 2008).
EU firms are a biased sample. Their firms are more capital intensive with fewer employees than otherwise because labour is so expensive to hire in the EU. Small and medium sized firms can struggle to grow in much of the EU because of regulatory burdens that phase in with firm size (Garicano, Lelarge and Van Reenen 2012; Hobijn and Sahin 2013; Rubini, Desmet, Piguillem and Crespo 2012). Average firm sizes are 40 percent smaller in Spain and Italy than in Germany. Obstacles to firm growth originate in product, labour, technology and financial and the binding constraints differ from one EU member state to another (Rubini, Desmet, Piguillem and Crespo 2012).
Bartelsman, Haltiwanger, and Scarpetta (2009) found that the USA had a very high proportion of above-average sized firms. Western Europe had smaller firms in most industries with one of the exceptions in low-tech UK industries. Apart from the USA, they could not map differences in firm size against the overall size of the country, the technology levels of an industry, or its degree of maturity.
Another confounding factor is the average number of employees in firms with 500 or more employees in France and New Zealand is similar: 1667 and 1593 respectively (Mills and Timmins 2004; Hobijn and Sahin forthcoming). Preferring the UK over France as the benchmark for very large firms calls for a detailed analysis of Anglo-French institutional differences. This defeats the very purpose of the simple statistical comparisons undertaken to date. These simple cross-national statistical comparisons presuppose relatively common economic drivers and institutional backgrounds. If that is not so, a detailed institutional analysis is required before cross-national comparisons are possible. Bartelsman, Haltiwanger, and Scarpetta (2009) suggest that cross-national comparisons of firm dynamics and firm size distribution are subject to substantial definitional and measurement problems and no one measure will capture properly the many institutional and regulatory differences.
Average firm sizes in the USA and UK may be larger because of fewer tax and regulatory policies that limit business growth. Bartelsman, Scarpetta and Schivardi (2005) found that new entrants in the U.S. started on a smaller scale than in Europe but grew at a much higher rate. This willingness to experiment on a smaller scale was worth the risk because the payoff was much larger in terms of growth in the more flexible U.S. markets.

New Zealand’s tourism industry halved in size in the last 2 years but it is only a statistical revision
11 Mar 2016 Leave a comment
in economic history, industrial organisation, politics - New Zealand, transport economics
At 4% of GDP and employment in 2014, that is half estimated size of the New Zealand tourism sector in 2012. Statistics are only estimates. The trouble is politicians and bureaucrats make decisions on the base of them that might not be able to be reversed. Little wonder that Hong Kong prospered by as collecting as few as statistics as possible.
Source: OECD Tourism Trends and Policies 2016 | OECD READ edition.

Source: OECD Tourism Trends and Policies 2014 | OECD READ edition.
The earlier New Zealand data referred to direct and indirect contributions while the latest data refers only to direct contributions. New Zealand is no longer top of the world.
Crime Deterrence: Evidence From the London 2011 Riots
10 Mar 2016 Leave a comment
in economics of crime, politics - New Zealand

@BernieSanders there is no other side to Cuba – a totalitarian dictatorship
10 Mar 2016 Leave a comment
in development economics, liberalism, Marxist economics, politics - USA
The Scandinavian welfare states are mooching off the USA
10 Mar 2016 Leave a comment
in applied price theory, entrepreneurship, politics - USA, public economics
The welfare states in Scandinavia do not make their societies any less unequal than most other welfare states once you take into account taxes and transfers – after-tax redistributions.
Big bills left on the #livingwage sidewalk?
10 Mar 2016 Leave a comment
in applied price theory, entrepreneurship, managerial economics, minimum wage, personnel economics, politics - New Zealand
Living wage activists believe that businesses can profitably pay their low-paid workers a lot more. The living wage pay increase will not jeopardise the survival of the business or jobs because their workers will be more productive because of the living wage increase. Morale will be higher and job turnover will be lower. Both of these will increase productivity perhaps enough to offset the increase in labour costs.
In a nutshell, living wage activists have discovered a hitherto untapped entrepreneurial opportunity for profit. These living wage activists are happy to disclose this secret to lower costs to the world at no fee.
What they are arguing is businesses do not notice a profit opportunity that these political activists have noticed and are now publicising widely. Entrepreneurs are leaving money on the table that could easily be snapped up simply by paying their low-paid employers higher wages.

Source: Mancur Olson (1996) “Distinguished Lecture on Economics in Government: Big Bills Left on the Sidewalk: Why Some Nations Are Rich, and Others Poor.” Journal of Economic Perspectives 3-24.
This money on the table metaphor is similar to the big bills left on the sidewalk metaphor. There is easy money to be had from paying low-paid workers more because these workers will quickly become more productive because of the higher wages.
Living wage activists do not address why entrepreneurs had not discovered this insight into cost saving themselves. After all, every entrepreneur, every employer knows that if they pay more, they will get a better class of job applicant.
Of course, if this insight by the living wage activists is true, all workers should be given a similar increase in their pay because their productivity will go through the roof as well.
Entrepreneurs profit directly from spotting every new opportunity for profit. They have no reason to turn money down particularly when it is obvious and straight under their nose.

The modern theories of the firm focus, in part or in full on reducing opportunistic behaviour, cheating and fraud in employment relationships. The cost of discovering prices and making and enforcing contracts and getting what you pay for are central to Coase’s theory of the firm put forward in 1937.
The profits of entrepreneurs for running a firm is directly linked from their successful policing of the efforts of employees and sub-contractors to ensure the team and each member perform as promised and individual rewards matched individual contributions (Alchian and Demsetz 1972; Barzel 1987). Alchian and Demsetz’s (1972) theory of the firm focused on moral hazard in team production. As they explain:
Two key demands are placed on an economic organization-metering input productivity and metering rewards.
The main rationale in personnel economics from everything ranging from employer funding of retirement pensions to the structure of promotions and executive pay including stock options is around better rewarding self-motivating employees who strive harder and reducing the costs of monitoring employee effort.
Does a higher minimum wage really reduce employment? econ.st/1gp4Jbs http://t.co/WGMZGLKHmI—
The Economist (@EconBizFin) July 30, 2015
At bottom, the efficiency wage hypothesis is entrepreneurs are unaware of the higher quality and greater self-motivation of better paid recruits for vacancies but wise bureaucrats and farsighted politicians notice these gaps in the market. Bureaucrats and politicians notice these gaps in the market before those who gain from superior entrepreneur alertness to hitherto untapped opportunities for profit do so and instead leave that money on the table.
Inequality is not getting worse and worse says @WJRosenbergCTU!?
09 Mar 2016 Leave a comment
in economic growth, economic history, politics - New Zealand, unions
Bill Rosenberg of the Council of Trade Unions is one of many economists who point out that income inequality has not been getting worse and worse in New Zealand since the 1990s. Inequality rose sharply in the late 1980s and early 90s but has remained high but nevertheless stable since then as he says in his 2014 paper of trends in living standards:
This is another symptom of the sharp rise in income inequality between the mid 1980s and mid 1990s, which remains high.
His employer, the Council of Trade Unions when it was denouncing the Employment Contracts Act 1991 as the reason for low wages growth has also drawn attention to the early 1990s as a turning point in the relationship between inequality, union bargaining power and wages growth.
As the Council of Trade Unions showed in the chart it published during the last election campaign, which I snapshoted below and also annotated, from 1970 to 1975 there was rapid real wages growth, well in excess of real growth in per capita GDP. This wages breakout was followed by some ups and downs but essentially wages in 1995 were no higher per hour from what they were in 1975. Real wages were about $24 per hour in real terms in New Zealand for about 20 years – from 1975 to 1995.
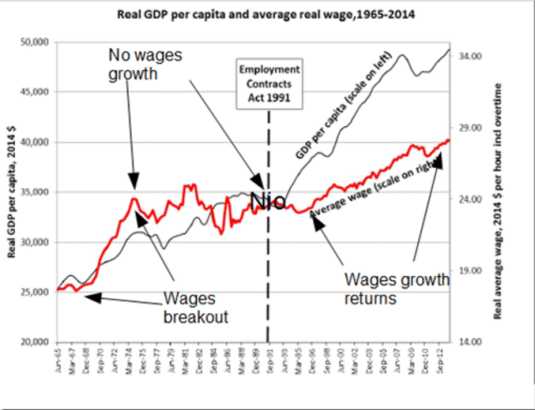
There was no real GDP per capita growth from 1975 until 1979 nor in the five years leading up to the passage of the Employment Contracts Act 1991. The period leading up to 1975 wages breakout wages was the zenith of union membership; nearly 70% of all workers belonging to a union. Less than 20% do now and less than 10% in the private sector.
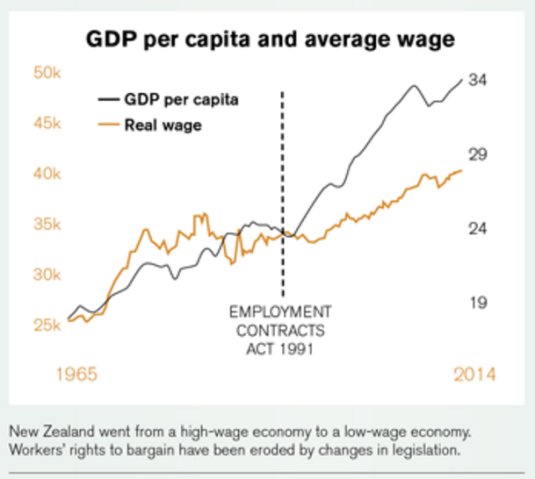
Source: Income Gap | New Zealand Council of Trade Unions – Te Kauae Kaimahi.
After staying at about $24 per hour for 20 years from 1975 to the early 1990s, following the passage of the Employment Contracts Act in 1991, average wages in New Zealand have increased steadily from $24 an hour to about $28 per hour by 2014 in one of the most deregulated labour markets in the world.
As Rosenberg, who is chief economist at the Council of Trade Unions, and the Council of Trade Unions itself pointed out, there were major changes in the New Zealand economy in terms of inequality of incomes and union bargaining power in the late 80s and early 1990s.
These changes referred to by the unions as an erosion of workers bargaining power, brought an end to wage stagnation. Steady real wages growth returned after two lost decades: next to no growth in either GDP per capita or incomes of workers.


Recent Comments