
Source: Ron Haskins (2015).
Celebrating humanity's flourishing through the spread of capitalism and the rule of law
13 Jan 2016 Leave a comment
in gender, labour economics, labour supply, politics - New Zealand, politics - USA, poverty and inequality, welfare reform Tags: 1996 US welfare reforms, female labour force participation, maternal labour force participation, single mothers, single parents, social insurance, welfare state
Source: Ron Haskins (2015).
12 Jan 2016 2 Comments
in applied welfare economics, politics - New Zealand, poverty and inequality
12 Jan 2016 Leave a comment
in applied welfare economics, economic history, politics - New Zealand, poverty and inequality
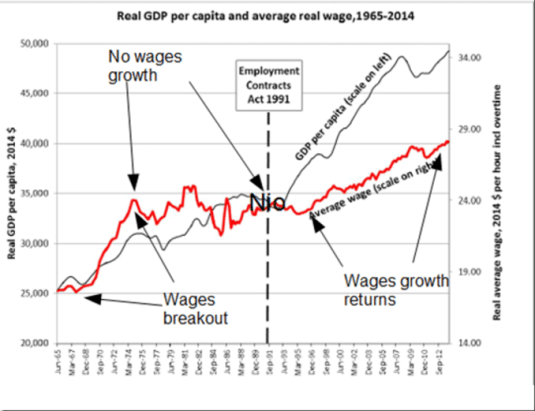
After two lost decades from 1974 where there was real wage stagnation and next to no real GDP growth, following the Mother of All Budgets in 1991 under Ruth Richardson and the passage of the Employment Contracts Act in the same year, real wages growth returned after a hiatus of 20 years. These 20 years of real wage stagnation were the good old days if the Leftover Left is to be believed.

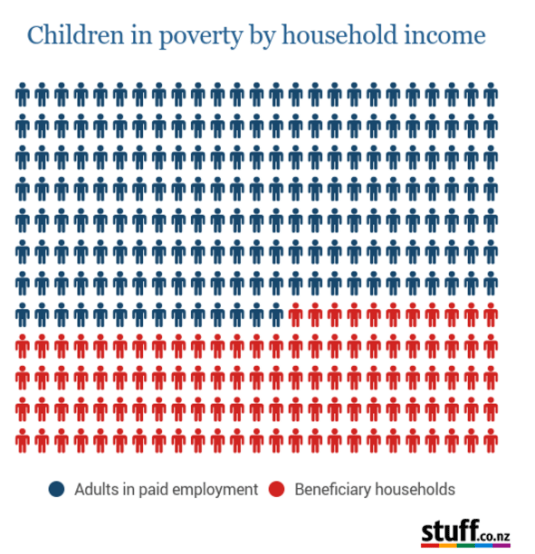
Source: Child Poverty Monitor: 2015 Technical Report, figure 39.
12 Jan 2016 Leave a comment
in economic growth, macroeconomics, politics - New Zealand
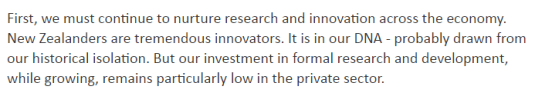
With 99% of global R&D undertaken overseas, Steven Joyce, the Minister for Economic Development, simply missed the point in an op-ed today as to what was important in raising New Zealand’s economic growth potential. As a technology follower, the issue is New Zealand’s ability to import and absorb the latest technological innovations from overseas. The extent of local
Source: Steven Joyce: A chance for a land of milk and money – Politics – NZ Herald News.
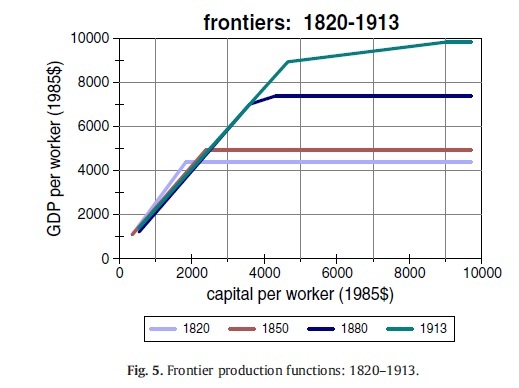
Different national abilities to absorb technology innovations that were developed by the countries at the global frontier such as the USA will result in different national growth rates for countries that are technological followers (Acemoglu et al. 2006; Aghion and Howitt 2005, 2006; Howitt 2008). As a technological follower nation such as New Zealand approaches the global technological frontier, the types of institutions required for successful technology absorption changes markedly.
The world growth rate is driven by discoveries in the technologically leaders such as the USA, Japan, Germany, UK and France (Barro and Sala-i-Martin 1999). The richest OECD member countries are rich because they use almost all of the available global pool of useful technological knowledge. Their further growth is limited to growth in the global pool of technological knowledge (Parente 2001).
Technological followers such as Australia, Canada, and New Zealand converge toward the global technological leaders because copying is cheaper than innovation over some range. The cost of imitation is estimated to be 40 to 90 per cent of the cost of an innovation (Barro and Sala-i-Martin 1999). This ability of economic development latecomers to grow rapidly by importing and copying frontier technologies is the ‘advantage of backwardness’ (Gerschenkron 1952).
Appropriate institutions and distance from the global technology frontier
The kind of institutions and economic policies that are appropriate to sustain convergence and technology transfer evolve and become more demanding as a country approaches the global technological frontier (Acemoglu et al. 2006; Aghion and Howitt 2005, 2006). The key point from the discussion of endogenous growth theory that is to follow is that institutions that favour the implementation of imported technologies may not necessary favour innovation (Aghion and Howitt 2005, 2006).
The political, tax and regulatory institutions that favour the more ready-made implementation of more standardised imported technologies do not necessarily favour the growing demand for the domestic innovations in New Zealand as the global technological frontier nears. There is a growing demand for more highly skilled workers to master and adapt the leading-edge technologies to the distinctive circumstances of each New Zealand workplace.
 By innovation, I do not mean the lab coats model of R&D where boffins invent new products. By innovation, I mean workplace innovation where New Zealand workers master the latest technologies so they can squeeze every drop out of these new and upgraded products and adapt them to New Zealand markets.
Innovation is much more than the R&D that leads to design blueprints for new or upgraded products and production process. Technology transfer is much more than the unpacking of imported new equipment and production processes, the reading of the associated blueprints and operating manuals and some training when the latest imported technology is more complex and less established.
Technologies can be ranked in the level of human capital required in workers. Some technologies are routine in operation and implementation. Others can be much more complex and require local innovations in how the technology is operated and the workers need to be highly educated, well-trained and able to follow quickly the latest technological developments (Nelson and Phillips 1966).
Innovation is getting harder
As technology progresses, each new and upgraded product is a smaller and smaller increment and what came before. Innovation is haunted by fishing-out effects. The easier innovations are discovered first with more and more R&D and adaptation efforts required for further successes. With technological knowledge ever accumulating, and a greater complexity of new innovations, each new generation of innovators and workers that used new technologies face an increasing educational and research burden.
R&D efforts, human capital investments and on-the-job learning must be spread more and more thinly over a greater number of different sectors, products and production processes. Product proliferation requires a society to make ever-increasing investments in R&D, in human capital and in on-the-job learning to innovate and adopt and adapt new technologies at the same pace as before.
The trend rate of productivity growth did not accelerate over the 20th century despite a massive rise in investments in human capital and R&D because of the rising cost of discovering and adapting new technological knowledge. The number of both R&D workers and highly educated workers increased many-fold over the 20th century in New Zealand and other OECD member countries including the global industrial leaders such as the USA, Japan and major EU member states.
Trend productivity growth did not accelerate because innovation is simply getting harder. As modern technology advances, each new technology is more complex and the number of products and production processes proliferate exponentially.
Technology absorption is getting harder
In implementation models of technology diffusion, the imported technology is very much ready-made and proven rather than a recent innovation. Implementation it is more of an issue for developing countries where they lack many technologies. They are introducing proven technologies that spread widely in developed countries decades previous. It is really about unpacking the box and plugging it in.
Far from the frontier, the technology gap is so large so that growth in productivity from each innovation on the relatively old predecessors is large. As a laggard moves closer to the global technological frontier, the impact of each successive technology import will decline. The newer technology is a smaller and smaller upgrade on what it replaces (Aghion and Howitt 2005, 2006, 2009).
Close to the global technological frontier, there is less room for copying and easy adoption of well-established technologies. Many of the latest technologies are small upgrades on the previous product. Skill and entrepreneurial endeavour is needed to harvest all of the latest available quality improvement.

As technology followers such as New Zealand approach the global technological frontier, the institutions appropriate for continued productivity growth change. As a country moves closer to the global technological frontier, the impact of each successive technology import will decline. The latest imported technology is usually a smaller and smaller upgrade on before. A more skilled workforce and greater entrepreneurship is needed to squeeze out all of the available productivity and product quality gains from the latest imported technologies. This is in contrast to Mr. Joyce’s lab coats model where boffins spend R&D handouts from him.
As a country nears the global technological frontier, the impact of each successive technology imports is smaller. The newest imported technology is a smaller and smaller upgrade on what it replaced. A more skilled and experienced workforce is needed to meet the challenge to squeeze out all of the available productivity and product quality gains from the latest technologies (Ha and Howitt 2007).
The initial incarnations of new production technologies and new products are often expensive and bug-infested. Skilled and seasoned operators are needed to oversee their introduction and testing. Later versions of new products and processes are far more reliable and much cheaper to run. There are gradual improvements in quality of the product and in the way in which and the scale on which the product is produced and maintained. As a new technology becomes more established, there is less demand in the adopting firms for more skilled labour and an increased demand for less skilled labour (Greenwood 1999).
A leading reason behind the one to two decade or longer delay in any new technology moving from use by 10 per cent of an industry to 90 per cent use are the complexities of mastering new technologies. Jovanovic and Lach (1997) found a 15-year lag to go from 10 per cent to 90 per cent use for the 21 innovations they reviewed. Even for transformational technologies ranging from electricity to the Internet, a host of secondary innovations had to be invented, adopted and mastered over several decades before the most was made on their potential.
Access to technologies depends upon having a suitably prepared workforce. The costs of technology absorption and imitation are lower the more abundant is human capital in the technology importing country (Nelson and Phelps 1966; Benhabib and Spiegel 2005). A high proportion of skilled workers in the labour force are an inviting market to develop technologies to compliment those skills (Acemoglu 2002, 2003).
Many technologies developed by the industrial leaders are designed to make best use of the skills that are in good supply in the workforces of these countries. These skills are less abundant in follower countries. Some of the tasks performed by skilled workers in the industrial leaders will be carried out by less skilled workers when they use the same technology in a follower country. Since the technology is designed for use by skilled workers, productivity will be lower in countries with less of the required human capital. This mismatch between skills and technology can lead to sizable differences in total factor productivity and output per worker (Acemoglu and Zilibotti 2001).
Why did the EU stop catching-up?
The end of the EU’s productivity convergence with the USA from the late 1980s has been partly attributed to not making the shift from technology implementation enhancing institutions to innovation enhancing institutions (Aghion and Howitt 2005, 2006). Different types of policies or institutions appear to be growth-enhancing at different stages of development.
The institutions of the EU member states may have become inappropriate to its increasing proximity to the global technological frontier. Many of the EU member states had caught up with USA in capital-labour ratios and labour productivity. The institutions of the EU were the appropriate growth-enhancing institutions during this prior period of catch-up with the USA. The EU then reached the world technology frontier by the 1990s and this exhausts capital accumulation and technological imitation as sources of growth for technology laggards. By the 1990s, Europe needed to develop institutions that promoted innovation.
The EU had to switch over to innovation enhancing institutions but it did not successfully make this move. This switch required regulatory and tax reforms and more national investment in R&D and higher education. The EU falls short on these new institutional requirements because it lags the USA by 25 to 50 per cent in R&D and higher education spending relative to GDP and in the educational attainment of the respective workforces (Aghion 2006). The institutions of the EU were appropriate to facilitating catch-up but not to the encouraging of innovation.
The end by 1990 of the EU’s productivity convergence on the USA has been partly attributed to not making the policy shift from technology implementation enhancing institutions to innovation enhancing institutions. EU members invested far less than the USA in R&D and tertiary education had more rigid labour and product markets, had less entry and exit of firms, and much higher taxes.
Implementation-based and innovation-based policy regimes
The intensity and mix of innovation and imitation in a country will depend on institutions, policies and the composition of human capital in ways that vary with a country’s distance to global technological frontier (Aghion and Howitt 2005, 2006, 2009). Imitation of the technological leaders may be enhanced by long-term investments in large existing firms.
Innovation depends more on skill adequacy and is enhanced by institutions which screen out managers and allow shareholders to dismiss those who underperform. Innovation often requires initiative, risk-taking, the selection of good projects and talents, and the weeding out of those that are not to be profitable (Aghion and Howitt 2005, 2006).
The political, tax and regulatory institutions that favour the more ready-made implementation of more standardised imported technologies do not necessarily favour the growing demand for the domestic innovations in New Zealand as the global technological frontier nears. There is a growing demand for more highly skilled workers to master and adapt the leading-edge technologies to the distinctive circumstances of each New Zealand workplace to stay ahead in rapidly changing competitive environments and meet the changing needs of customers.
Productivity growth is not manna from heaven. Every increase in productivity and in product quality and variety are the sum of many inventions that must be first discovered by prospective innovators building on past ideas and developed, tested, adopted and adapted by profit-minded entrepreneurs and workers. Investments in R&D, in human capital and in on-the job learning and in the entrepreneurial judgments about risking investments in the new technologies that all underpin further growth in productivity are all influenced by public policies.
Far from the global technological frontier, the policy regime and institutional background of a technological follower can promote implementation based growth with established firms and an emphasis on a good primary and secondary education of workers.
Closer to the global technological frontier, capital accumulation and technological imitation will have been exhausted as the main sources of growth (Aghion and Howitt 2005, 2006). A country must turn to innovation, which is the ability for firms and highly skilled workers to move rapidly into new technologies and products and improve production processes. This calls for different skill levels and entrepreneurial approaches to implementation (Aghion and Howitt 2005, 2006). Tertiary education will became much more of a priority closer to the frontier.
As a country moves closer to the global frontier, its technological capabilities must change from just implementing imported technologies to modern R&D. Modern R&D draws heavily on scientific knowledge and methods, and requires higher skill levels (Aghion and Howitt 2005, 2006, 2009). The implementation of the more sophisticated imported technologies requires a more skilled work-force.
Modern R&D uses resources, including skill labour, to generate new knowledge about technological possibilities and these endeavours use scientific principles and methods to build on previous knowledge (Aghion and Howitt 2005, 2006; Ha and Howitt 2007). Invention and the lab-coat vision of R&D is a small part of modern innovation. Only a small fraction of R&D expenditures even in the USA is actually spent on invention and basic research. Most R&D is about the development and the adaptation of ideas for practical uses in the workplace and elsewhere (Jovanovic 1997; Greenwood and Jovanovic 2001). The majority of spending on schooling, on-the-job training and learning by doing, 10-15 per cent of GDP or more, is about informing students of their menu of technological options and preparing them to adapt these options to a great variety of both known and yet to be discovered uses (Jovanovic 1997; Greenwood and Jovanovic 2001).
Institutions that foster technology absorption
Productivity growth in New Zealand is principally about making the most of technology transfer by absorbing and adapting overseas invented technologies. The nature of technology absorption changes as a country approaches the global technological frontier. New Zealand can no longer rely on its workforce and entrepreneurs implementing of more straight-forward new product designs and new production process invented in the research sectors and workplaces of the global leaders to keep local productivity growing at two per cent per year.
As an economy approaches the world technology frontier, there must be a switch from an implementation-based regime to an innovation-based policy regime with younger firms, fewer incumbents, better educated workers and more entry and exit. These newer and younger firms will be the standard bearers of the latest technologies. The threat of more new entry will induce incumbent firms to innovate more to parlay this growing threat of displacement be new entrants.
The local workforce must up-skill if the more leading edge technologies are to be understood and adapted. These technologies are designed to be used by more educated workers able to meet the challenges of operating complex technologies. The leading-edge technologies are more productive if paired with more highly skilled workers. Many secondary innovations and local adaptations are needed before the new technology can be fully mastered. These local technological adaptations are more complex and costly than for the prior technologies.
Close to the global technological frontier, firms and workers must be able and skilled enough to move rapidly into new activities and the latest technologies and be able to quickly improve and refine production processes and product designs. More and more of productivity growth will come from a rapid expansion of a locally based class of educated people who spend their careers exchanging ideas, solving work-related problems and generating new knowledge. Large productivity gains can be lost if there is a mismatch between technologies and the skills of the workers that operate it (Acemoglu and Aghion 2001).
Many legal and economic institutions must change. Changes are required to competition and entry policies, the funding to higher education, and the design of macroeconomic and tax policies that encourage investment, domestic savings and investment in human capital (Aghion and Howitt 2005, 2006, 2009). For example, more investments in higher education speeds transfer of the most complex frontier technologies.
The composition of human capital is important as the global technology frontier approaches. More and more university graduates are required to adapt the latest technologies successfully. This is partly because skilled labour is used intensively in the R&D process needed for the technology transfers.
It is also because the benefits from the diffusion of more complex technologies from the global leaders are faster where there are skilled local workers able to adapt these technologies and to use them most productively in-country. An effective education system will have a positive effect on long-run growth by increasing the efficiency of innovation technologies and investments, both of which are highly skill intensive, and by reducing the cost of skill labour, which in turn increases the profits that accrue to successful innovators and rapid technology adaptors.
Schumpeterian endogenous growth theory
The Minister of Economic Development is simply missed the second generation of endogenous growth theory and in particular Schumpeterian growth theory:
This new theory is explicit about who gains from technological progress, who loses, how the gains and losses depend on social arrangements, and how such arrangements affect society’s willingness and ability to create and cope with technological change.
The more demanding institutional requirements on countries that are closing in on the global technology frontier can make reform a prerequisite to continued current growth rather than higher trend growth. Entrepreneurial rewards drive invention and innovation and the import and adaptation of new technologies.
Innovation and adaptation becomes more complex as technology advances. Larger and longer investments are required in human capital to overcome the rising burden of knowledge to learn enough to continue innovating and adapting at the current pace. This made reforms to the adequacy of the rewards for entrepreneurship and human capital of increased importance in recent decades.
Lower company tax and less labour market regulation are the biggest contributions that government can make to raising the growth potential of the New Zealand economy. Instead, Stephen Joyce focuses on giving more and more handouts to boffins rent seeking boffins. The real innovators, the real entrepreneurs in the New Zealand economy responsible for importing and adapting the latest technologies from overseas must therefore carry an extra burden, a higher company tax, because of the success for rent seeking by boffins.
12 Jan 2016 Leave a comment
in comparative institutional analysis, politics - New Zealand, Public Choice
11 Jan 2016 Leave a comment
in economic history, politics - Australia, politics - New Zealand, politics - USA Tags: baby boomers, marijuana decriminalisation, rational irrationality, voter demographics

11 Jan 2016 Leave a comment
in economic history, politics - New Zealand, poverty and inequality

Source: Donna Wynd, Hard to Swallow Foodbank Use in New Zealand (2005).
David Armstrong claimed incorrectly that there have been no food banks in New Zealand until recently:
That’s how it used to be here not so long ago, when foodbanks didn’t exist and the number of homeless was tiny. I remember when we had few cases of “poverty” diseases such as rheumatic fever or rickets.
What else explains the increased popularity of food banks, which have been long-standing in New Zealand, it is not falling wages.
The main economic development over the last 25 years is the return of real wage growth after decades of wage stagnation in the boys own good old days of David Armstrong.
Source: Low Wage Economy | New Zealand Council of Trade Unions – Te Kauae Kaimahi.
As for the number of homeless being tiny in the good old days of New Zealand, a New Zealand Parliamentary Library 2014 paper on homeless started its historical narrative in 1850 and spent a lot of time discussing housing deprivation in the early and mid-20th century:
A 1936 national survey found nearly a third of the total urban housing stock was unsatisfactory and 15% of this only fit for demolition. [5] Māori in particular experienced poor housing conditions. The first Labour Government loaned money for private house purchases and built state housing to rent.
During the 1950s, the National Government moved to reduce the waiting list for state housing and promoted home ownership, but lengthy waits for some people were reported. Likewise, concern was expressed over severe overcrowding, especially among Māori. By the late 1950s, Wellington’s housing needs were identified as ‘particularly acute.
In the 1960s voluntary organisations recorded a gradual increase in some groups experiencing housing difficulties. The Christchurch Methodist Church night shelter found that their main users were employed people who could not afford other accommodation, unmarried women with children, and those leaving homes because of domestic violence also increasingly sought shelter
Not even a self-described liberal elitist of the left can be forgiven for forgetting some of the key achievements of the first Labour government in social housing. The idea was to improve the quality of New Zealand housing for the poor.

Source: The first state house – State housing | NZHistory, New Zealand history online.
In common with Max Rashbrooke, David Armstrong’s recollection of his boys own childhood does not include Maori as they drifted to the city. Prior to the middle of the 20th century about 85% of Maori lived in rural areas, often lacking electricity, running water and living on dirt floors as the Encyclopaedia of New Zealand explains:
Attracted by work opportunities and the ‘bright lights’ of city life, rural Māori began to move to Auckland and Wellington in the 1920s. However, many faced problems finding accommodation. The reputation Māori had among Pākehā for overcrowding and taking poor care of their homes meant few landlords were prepared to have them as tenants. As attendee James Rukutoki told a Māori leaders conference in 1939, ‘the only dwellings open to the Maori are the ramshackle discards of the Pākehā’.
11 Jan 2016 Leave a comment
in applied welfare economics, politics - New Zealand, poverty and inequality
Keith Ng stumbled onto an interesting point in a Twitter feud yesterday before he muted me about what is the poverty rate for. Are we interested in the poverty rate before government transfers and other social assistance or after them? Why?
If you are making the case for more assistance to the poor, the correct poverty rate measure is after the existing government assistance. Interestingly, most of those making the case for greater assistance to the poor use the before government transfer measures of poverty rates.
The reason why the correct measure is after government assistance is you are attempting to measure whether the assistance to date has provided people with an adequate standard of living. The before government assistance poverty rate provides no insight into that question.
The recent calculation by the Treasury of inequality based on income and consumption illustrates this. Most people are concerned about what people have to spend rather than how much they earn when thinking about topping them up with government social assistance.
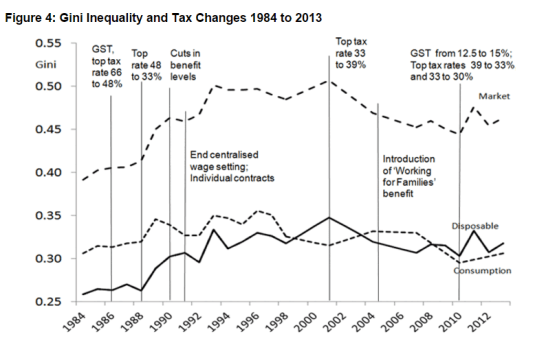
Source: Inequality in New Zealand 1983/84 to 2013/14 (WP 15/06) — The Treasury – New Zealand
As the above chart shows, consumption inequality in New Zealand has not changed much since 1984 while income inequality has. Which is more important how much people have to spend or how much they are? Growing inequality is not a reason for more government assistance to the poor in New Zealand because it simply has not got worse for 30 years.
The reason that the before government assistance poverty rate is used is this rate is a relative measure that does not fall by that much. It therefore helps dramatise the politics of poverty and perhaps strengthen your case in the eyes of low information voters.
The better guide is the poverty rate after government assistance because that tells you how much extra you really need to top up the incomes of the poor to ensure they have an adequate minimum standard of living. The before government assistance poverty rate provides no insight into the success of social insurance and the welfare state regarding the adequacy of income support for the poor.
10 Jan 2016 Leave a comment
in applied welfare economics, economic history, politics - New Zealand, politics - USA, poverty and inequality
The official poverty rate in the USA missed poverty falling to near zero by the eve of the Global Financial Crisis in 2007 as shown in the chart below. That is no small oversight. It calls into question whether the official poverty rate which is based on a percentage of the median income is a useful guide to the magnitude of social problems before us.
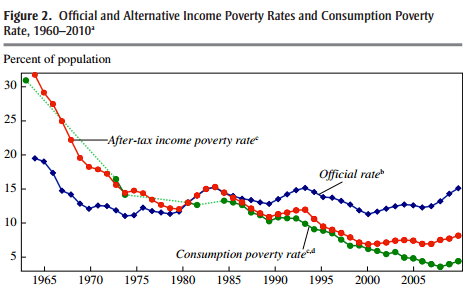
Source: Meyer and Sullivan (2012), p. 153.
Meyer and Sullivan calculated a consumption based measure of poverty and found that the poverty rate fell much faster than previously single digits.
People worry about poor not have enough, not how much income they have before taxes and social insurance. The official poverty rate is before tax and social insurance and therefore before how much the poor actually have to get by with after receiving social assistance of all types and sources.
Interestingly, the divergence between consumption-based poverty and income-based poverty started with the election of Reagan and picked up the US federal welfare reforms in 1996. The number of children in poverty in deep poverty fell immediately after those 1996 US welfare reforms. There is a lesson in that for New Zealand.
It is widely agreed that the official poverty rate is flawed. Measuring poverty as a percentage of median income, usually 60% of the median income, means that poverty may not fall despite incomes doubling every generation and more.
Indeed, increases in the median income can increase poverty without anyone being poorer. This is because the gap between the median income earners and the poor increased such as the New Zealand in 2014 without any of the poor experiencing a fall in income and social support.
The reason why the median is pulling away from the bottom – the reason why income distribution is fanning out – is more people going to university and securing the associated wage premium and the greater rewards for talent in a globalised world.
The forces behind greater educational attainment and the globalisation of markets benefit all and in particular those of bottom of the income distribution through a more prosperous, dynamic, innovative society.
09 Jan 2016 Leave a comment
in applied welfare economics, economic history, human capital, labour economics, politics - New Zealand, poverty and inequality Tags: Leftover Left, superstar wages, superstars, top incomes
Apart from a bump in the late 80s, the top income earners in New Zealand really are not doing much better than they were in the 1950s or 1920s. The rich are not getting richer in New Zealand. They are just holding their own.

Source: The World Wealth and Income Database.
08 Jan 2016 2 Comments
in applied price theory, economic history, politics - Australia, politics - New Zealand, politics - USA, poverty and inequality Tags: Australia, Leftover Left, top 1%
What slackers. Despite 30 years of neoliberalism oppressing the unions and working class, the top 1% in New Zealand (and Australia) are unable to do any better in terms of their share of national income than in the good old days of pre-1984 New Zealand looked upon with such fondness by the the Leftover Left.

Source: The World Wealth and Income Database.
08 Jan 2016 Leave a comment
in economic history, labour economics, politics - New Zealand, poverty and inequality Tags: child poverty, family poverty, Leftover Left, living standards, Maori economic development, Twitter left
https://twitter.com/sbancel/status/654162844884205568
Pakeha and Pasifika real household incomes increased by 55% since the low point of 1994. Maori household incomes increased by 65% since 1994.

Source: Bryan Perry, Household Incomes in New Zealand: trends in indicators of inequality and hardship 1982 to 2014 – Ministry of Social Development, Wellington (August 2015), Table D.6.
07 Jan 2016 Leave a comment
in politics - Australia, politics - New Zealand, politics - USA, population economics, urban economics Tags: housing economics, living standards
There are quite large differences in the number of rooms per person in the European offshoots and the countries in Europe. Americans have much more room per person than the much exalted welfare states of northern Europe.

Source: OECD Better Life Index – Data extracted on 07 Jan 2016 06:55 UTC (GMT) from OECD.Stat
07 Jan 2016 2 Comments
in Adam Smith, applied welfare economics, politics - New Zealand, poverty and inequality, Rawls and Nozick Tags: child poverty, family poverty, star trek
Jamie Whyte today wrote an excellent op-ed on the meaninglessness of current measures of poverty. His point was that defining poverty as 60% of the median income means the poor will always be with us. This relative definition of poverty misleads us as to the level of hardship and deprivation in society as Jamie Whyte says today:
There is no poverty in New Zealand. Misery, depravity, hopelessness, yes; but no poverty.
The poorest in New Zealand are the unemployed. They receive free medical care, free education for their children and enough cash to pay for basic food, clothing and (subsidised) housing. Most have televisions, refrigerators and ovens. Many even own cars. That isn’t poverty.
I agree that this definition of poverty in relative income terms is misleading and reflects a political agenda. When I was young, the poor were thin, now they are fat.
Poverty rates have not changed despite a greater abundance of food. Indeed, child poverty rates have increased since I was young despite this relative opulence of food.
Over the Christmas break I read Simon Chapple and Jonathan Boston’s Child Poverty in New Zealand. They included a discussion of what was poverty drawing on the relative concept of poverty of Adam Smith. Smith spoke about wrote about the differences in poverty between countries and across time:
A linen shirt … is, strictly speaking, not a necessary of life. The Greeks and Romans lived, I suppose, very comfortably though they had no linen.
But in the present times, through the greater part of Europe, a creditable day-labourer would be ashamed to appear in public without a linen shirt, the want of which would be supposed to denote that disgraceful degree of poverty which, it is presumed, nobody can well fall into without extreme bad conduct.
In any society, a certain level of material well-being is necessary to not be in poverty. Smith also talked about how poverty lines differ between countries starting with the discussion about shoes:
The poorest creditable person of either sex would be ashamed to appear in publick without them. In Scotland, custom has rendered them a necessary of life to the lowest order of men; but not to the same order of women, who may, without any discredit, walk about bare-footed. In France, they are necessaries neither necessaries neither to men nor to women; the lowest rank of both sexes appear there publickly, without any discredit, sometimes in wooden shoes, and sometimes bare-footed.
Under necessaries, I comprehend, not only those things which nature, but those things which the established rules of decency have rendered necessary to the lowest rank of people.
All other things I shall call luxuries; without meaning by this appellation, to throw the smallest degree of reproach upon the temperate use of them. Beer and ale, for example, in Great Britain, and wine, even in the wine countries, I call luxuries. A man of any rank may, without any reproach, abstain totally from tasting such liquors. Nature does not render them necessary for the support of life; and custom nowhere renders it indecent to live without them.
Much of the Wealth of Nations was about the natural progress of opulence under a capitalist system. There is nothing wrong with inequality as John Rawls has explained.

The fact that citizens have different talents can be used to make everyone better off. In a society governed by the difference principle, those better endowed with talents are welcome to use their gifts to make themselves better off, so long as they also contribute to the good of those less well endowed.

With his emphasis on fair distribution of income, Rawls’ initial appeal was to the Left, but left-wing thinkers started to dislike his acceptance of capitalism and tolerance of large discrepancies in income.

Will the poor always be with us? I once had an argument with a colleague at work about whether there was poverty on the Starship Enterprise.
Star Trek was supposed to be a society that had abolished money and a post-scarcity economy because everything was available through a replicator. To quote Captain Picard:
A lot has changed in three hundred years. People are no longer obsessed with the accumulation of ‘things’. We have eliminated hunger, want, the need for possessions.
The economics of the future is somewhat different. You see, money doesn’t exist in the 24th century… The acquisition of wealth is no longer the driving force in our lives. We work to better ourselves and the rest of Humanity.
The Ferengi and their 285 rules of acquisition were a satire on capitalism. The Ferengi was originally meant to replace the Klingons as the Federation’s arch-rival but they were too comical.
Gene Roddenberry’s love story with socialism was a class-ridden society. In Star Trek, higher ranked officers had larger cabins, and most of all they always beamed back from the planet.

An old mate reminded me years ago that anyone who beamed down with Captain Kirk dressed in those red security officer tops were expendables. They were lucky to last 60 seconds in most episodes I watched.
Death and accommodation were class based on Star Trek but it was a supremely opulent society for everyone. That is the point to remember.
Standards are living are much better today than before for everyone despite inequalities that are quite acceptable under the difference principle of John Rawls.
Current definitions of poverty do not take into account the natural progress of opulence. In the 1970s, US Department of Energy started collecting its Household Energy Consumption Survey. This survey is one of the few accurate measures of growing affluence among the poor in America.
Not only does this survey ask about household appliances, it asked about on income. The survey is conducted every 4 years or so since the 1970s. Because of that, it is able to track the diffusion of appliances to households of varying incomes across America.
Yesterday’s luxuries at today’s necessities in poor households with a rapid diffusion of everything from air-conditioners to digital appliances. Many poor households in the USA have more space than middle-class households in Western Europe. Food is also much cheaper in the USA than in Europe.
https://twitter.com/VisualEcon/status/644080191841640448
This growing affluence of poorer Americans is despite higher measured family poverty in America according to the relative poverty measure based on the median income. That makes no sense.
06 Jan 2016 Leave a comment
in economics of regulation, health economics, politics - New Zealand

The commitment of the Greens to credible science is dropped like a stone when they discuss fluoridation.

The Greens are no less cranky when it comes to GMOs.

The Greens sacrifice what little scientific credibility they have left by not having a position on vaccinations and vaccine safety. I could not find any reference to it in their policy documents online.
https://twitter.com/KevinHague/status/642505850360213505
The Green Party health spokesman Kevin Hague has stated the Greens support of parents’ rights to choose which vaccine(s) (if any) their children receive without financial penalties.
Celebrating humanity's flourishing through the spread of capitalism and the rule of law
A History of the Alt-Right
Econ Prof at George Mason University, Economic Historian, Québécois
Celebrating humanity's flourishing through the spread of capitalism and the rule of law
Scholarly commentary on law, economics, and more
Beatrice Cherrier's blog
Celebrating humanity's flourishing through the spread of capitalism and the rule of law
Celebrating humanity's flourishing through the spread of capitalism and the rule of law
Celebrating humanity's flourishing through the spread of capitalism and the rule of law
Why Evolution is True is a blog written by Jerry Coyne, centered on evolution and biology but also dealing with diverse topics like politics, culture, and cats.
Celebrating humanity's flourishing through the spread of capitalism and the rule of law
A rural perspective with a blue tint by Ele Ludemann
DPF's Kiwiblog - Fomenting Happy Mischief since 2003
Celebrating humanity's flourishing through the spread of capitalism and the rule of law
The world's most viewed site on global warming and climate change
Tim Harding's writings on rationality, informal logic and skepticism
A window into Doc Freiberger's library
Let's examine hard decisions!
Commentary on monetary policy in the spirit of R. G. Hawtrey
Thoughts on public policy and the media
Celebrating humanity's flourishing through the spread of capitalism and the rule of law
Politics and the economy
A blog (primarily) on Canadian and Commonwealth political history and institutions
Reading between the lines, and underneath the hype.
Economics, and such stuff as dreams are made on
"The British constitution has always been puzzling, and always will be." --Queen Elizabeth II
Celebrating humanity's flourishing through the spread of capitalism and the rule of law
Celebrating humanity's flourishing through the spread of capitalism and the rule of law
WORLD WAR II, MUSIC, HISTORY, HOLOCAUST
Undisciplined scholar, recovering academic
Celebrating humanity's flourishing through the spread of capitalism and the rule of law
Res ipsa loquitur - The thing itself speaks
In Hume’s spirit, I will attempt to serve as an ambassador from my world of economics, and help in “finding topics of conversation fit for the entertainment of rational creatures.”
Researching the House of Commons, 1832-1868
Articles and research from the History of Parliament Trust
Reflections on books and art
Posts on the History of Law, Crime, and Justice
Celebrating humanity's flourishing through the spread of capitalism and the rule of law
Exploring the Monarchs of Europe
Cutting edge science you can dice with
Small Steps Toward A Much Better World
“We do not believe any group of men adequate enough or wise enough to operate without scrutiny or without criticism. We know that the only way to avoid error is to detect it, that the only way to detect it is to be free to inquire. We know that in secrecy error undetected will flourish and subvert”. - J Robert Oppenheimer.
The truth about the great wind power fraud - we're not here to debate the wind industry, we're here to destroy it.
Celebrating humanity's flourishing through the spread of capitalism and the rule of law
Celebrating humanity's flourishing through the spread of capitalism and the rule of law


Recent Comments