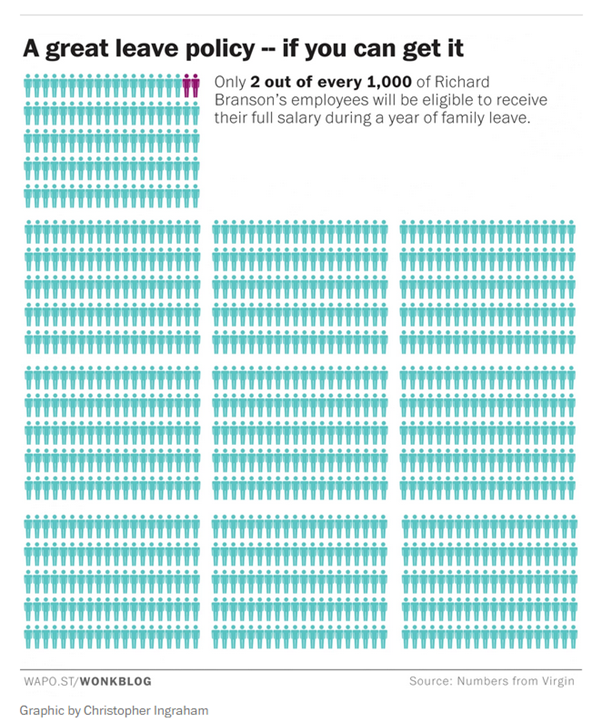
Richard Branson has announced a great paid leave policy for .2 percent of his workers
11 Jun 2015 Leave a comment
in discrimination, entrepreneurship, gender, labour economics, labour supply, occupational choice, politics - Australia, politics - New Zealand, politics - USA Tags: entrepreneurial alertness, maternity leave, paternity leave, Richard Branson
Trends in what drives single motherhood
11 Jun 2015 Leave a comment
Divorce used to be biggest engine of single parenthood in America. No more. It's nonmarital childbearing cc@davidfrum http://t.co/J5yZtUukNW—
W Bradford Wilcox (@WilcoxNMP) June 10, 2015
New Zealand primary school teachers have experienced rapid wages growth by international standards
10 Jun 2015 Leave a comment
in economics of education, human capital, labour economics, labour supply, occupational choice, politics - Australia, politics - New Zealand, politics - USA Tags: teachers pay
Should the New Zealand superannuation fund try to beat the market?
09 Jun 2015 Leave a comment
in entrepreneurship, financial economics, politics - New Zealand Tags: active investing, ageing society, demographic crisis, efficient markets hypothesis, entrepreneurial alertness, New Zealand superannuation fund, old age pensions, passive investing, retirement savings
Most mutual funds still can't beat their benchmark read.bi/1GkTig1 http://t.co/r7ezoDGJbV—
BI Chart of the Day (@chartoftheday) June 03, 2015
Household energy price inflation in New Zealand
09 Jun 2015 Leave a comment
in energy economics, politics - New Zealand Tags: child poverty, consumer price index, CPI inflation, energy prices, family poverty, fuel poverty, power prices
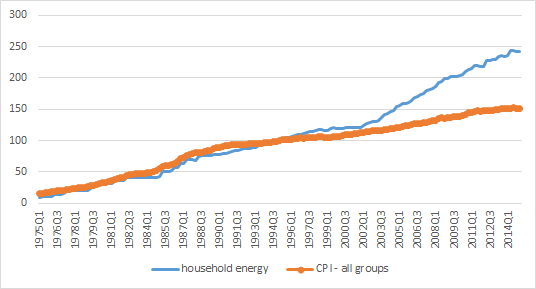
Energy prices seem to have been roaring ahead of consumer prices since the first quarter of 2001. Maybe that is a major contributor to fuel poverty in New Zealand and material deprivation among more poor households in the winter. What gives?
Figure 1: ratio of household energy price index to consumer price index – all groups, March quarter 1995 – March quarter 2015, base = 1995

Source: Statistics New Zealand Infoshare.
Figure 2: Household energy price index and consumer price index – all groups, March quarter 1975 – March quarter 2015, base = 1995
Source: Statistics New Zealand Infoshare.
Corporate welfare in New Zealand – 2015 budget update
09 Jun 2015 2 Comments
in applied price theory, applied welfare economics, comparative institutional analysis, economics of bureaucracy, industrial organisation, politics - New Zealand, rentseeking, survivor principle Tags: corporate welfare
I have updated my 2014 report on corporate welfare for the 2015 budget. My report was published today by the Taxpayers’ Union.
My key finding was that corporate welfare increased in the 7th budget of the National Party-led Government from $1.178 billion in its 2014 budget to $1.344 billion in the 2015 budget – see figure 1 and table 1.
Figure 1: Corporate welfare, Budgets 2008/09 to 2015/16

Source: New Zealand budget papers, various years.
Table 1: Corporate welfare in Budgets 2008/09 to 2015/16, $million
| 08/09 | 09/10 | 10/11 | 11/12 | 12/13 | 13/14 | 14/15 | 15/16 | |
| Arts, Culture & Heritage |
3 |
11 |
19 |
10 |
29 |
4 |
4 |
42 |
| Commerce and Consumer Affairs |
6 |
6 |
6 |
6 |
7 |
7 |
6 |
7 |
| Communications |
0 |
25 |
39 |
150 |
178 |
205 |
215 |
190 |
| Economic Development |
372 |
419 |
446 |
379 |
332 |
284 |
280 |
297 |
| Finance |
16 |
44 |
3 |
108 |
15 |
210 |
0 |
0 |
| Primary Industries |
700 |
0.3 |
14 |
0.0 |
43 |
65 |
77 |
180 |
| Science and Innovation |
0 |
4 |
0 |
0 |
0 |
112 |
219 |
269 |
| Tourism |
76 |
94 |
119 |
113 |
98 |
124 |
124 |
121 |
| Transport |
578 |
530 |
376 |
510 |
680 |
119 |
255 |
239 |
| Total $million |
1,751 |
1,134 |
1,022 |
1,277 |
1,382 |
1,130 |
1,178 |
1,344 |
Source: New Zealand budget papers, various years.
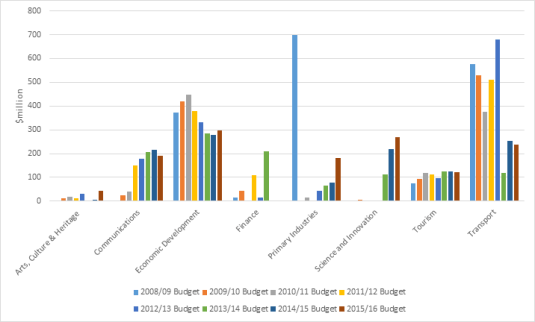
Corporate welfare has ranged between about $1 billion and $1.4 billion per year in each of the seven budgets presented by the current National-led Government – see Table 1 and Figures 1 and 2.
Figure 2: Corporate welfare, Budgets 08/09 to 15/16 by Vote
Source: New Zealand budget papers, various years; note: Vote Commerce and Consumer Affairs omitted in all years from Figure 2.
The predominant recipient of corporate welfare in this year’s budget, and all of those since 2008 is KiwiRail. Vote Transport accounts for a third of all corporate welfare – see Figures 3 and 4. Vote Economic Development is the next largest source of corporate welfare and accounts for 28% of the total since 2008 – see Figures 3 and 4.
Figure 3: Distribution of total corporate welfare across votes, 2008/09 to 2015/16

Source: New Zealand budget papers, various years.
Figure 4: State-owned enterprise welfare, Vote Transport and Vote Finance (KiwiRail), Budgets 08/09 to 15/16

Source: New Zealand budget papers, various years.
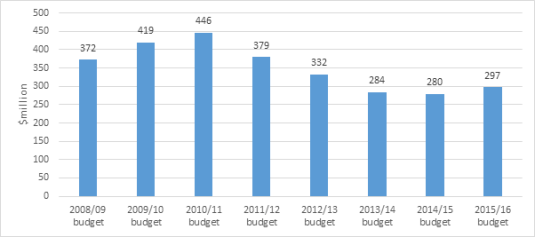
$280 – $450 million in corporate welfare has been under the patronage of the Minister for Economic Development over the last eight budgets – see Figure 5. In this year’s budget, corporate welfare under the Minister’s hand has increased slightly from $280 million to $297 million.
Figure 5: Corporate welfare, Vote Economic Development, Budgets 2008/09 to 2015/16
Source: New Zealand budget papers, various years.
Up until the 2013/14 budget, science and innovation spending was targeted at research that would not find private sponsors because it could not capture the returns from their discoveries – see Figure 6. Figure 6 shows that there is being rapid growth within Vote Science and Innovation of various forms of start-up and commercialisation grants in recent budgets.
Figure 6: Corporate welfare, Vote Science and Innovation, Budgets 08/09 to 15/16

Source: New Zealand budget papers, various years.
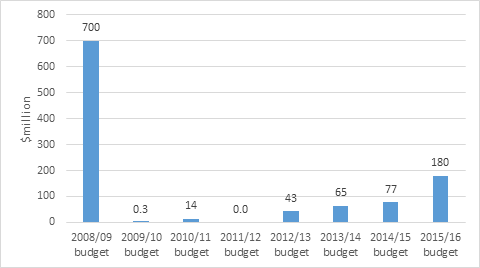
Figure 7 shows that the Government is getting back into the business of subsidising agriculture. The Primary Growth Partnership (PGP) is an R&D grants programme for the primary industry sector. There are 18 PGP programmes underway with a funding commitment from government and from industry combining to $708 million by 2017.
Figure 7: Farm welfare, Vote Primary Industries, Budgets 08/09 to 15/16
Source: New Zealand budget papers, various years.
Figure 8 shows that the National Party-led government is a major investor in ultrafast broadband – going where private entrepreneurs fear to tread.
Figure 8: Corporate welfare, Vote Communications, Budgets 08/09 to 15/16

Source: New Zealand budget papers, various years.
The corporate welfare in the Budget 2015 adds about six percentage points to the company tax rate. Should these corporate indulgences should continue or should the company tax rate drop six percentage points?
If that six percentage points on top of the company tax rate was renamed a business subsidies levy, how many businesses would want to pay it rather than developing their own business under much lower company tax rate?
The price, output and acreage effects of a GMO ban
08 Jun 2015 Leave a comment
in development economics, economics of regulation, environmental economics, growth disasters, growth miracles, health economics, politics - Australia, politics - New Zealand, politics - USA, population economics, technological progress Tags: agricultural economics, expressive voting, extreme poverty, global hunger, global poverty, GMOs, Left-wing hypocrisy, rational ignorance, rational irrationality, The Great Fact
Organic farming is a gift….
facebook.com/welovegv http://t.co/iu8Jq0KcHD—
C. S. Prakash (@AgBioWorld) June 05, 2015
Projected increases in corn and soy prices in a world without GMOs
ageconsearch.umn.edu/bitstream/2049… http://t.co/PNydjpl59K—
C. S. Prakash (@AgBioWorld) June 08, 2015
If you outlaw GMOs, be prepared to bring millions of acres of forest land, cropland & pasture under farming http://t.co/H9ftkxhXYe—
C. S. Prakash (@AgBioWorld) June 08, 2015
If GMOs are banned today in the US, what would be the crop yield reduction? http://t.co/pEn73PODcR—
C. S. Prakash (@AgBioWorld) June 08, 2015
Maggie Thatcher on the 2015 New Zealand budget
08 Jun 2015 Leave a comment
in politics - New Zealand Tags: 2015 Budget, Leftover Left
Quote of the Day: Lady Thatcher didn't always get a fair hearing. #QOTD http://t.co/qefQSZScka—
CPS Think Tank (@CPSThinkTank) May 18, 2015
How to argue for doing nothing about global warming when arguing for a climate club enforced by green tariffs!
08 Jun 2015 1 Comment
in environmental economics, global warming, politics - Australia, politics - New Zealand, politics - USA, Public Choice Tags: climate treaties, club goods, free-riders, global warming, green tariffs, international public goods
The best case I’ve seen recently for doing nothing about global warming was put by those arguing with the greatest sincerity and considerable technical skill that the next international climate treaty should be built around a climate club of those that comply with its obligations with green tariffs on those who do not join.
I have long argued that green tariffs are the only reason to do anything about climate change. Much better to collect the revenue ourselves than let it go into the pockets of a foreign taxman.
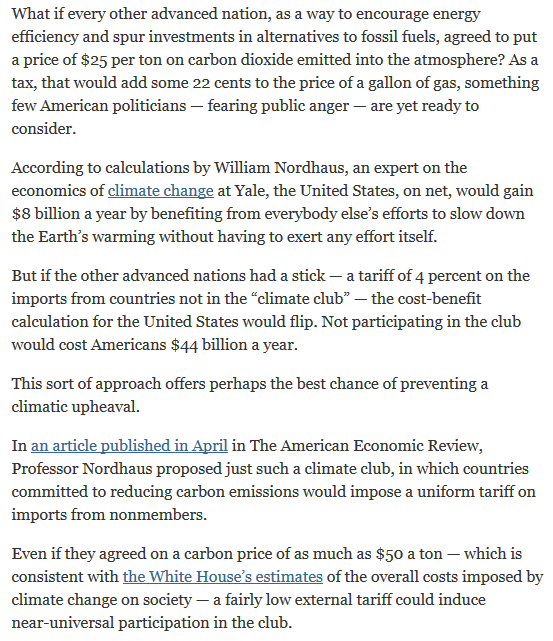
William Nordhaus has proposed climate clubs as a way of overcoming free riding in international climate negotiations. Specifically, the international climate treaty should authorise members to impose green tariffs on non-members to encourage them to impose their own carbon taxes and carbon emission targets. This has been done before with the Montréal protocol on CFCs. To encourage the phase-out of CFCs countries that did not commit to do so simply could not trade in those goods with members of the club.
via Climate Deal Badly Needs a Big Stick – NYTimes.com.
4%! A 4% global green tariff is all that is necessary under a climate change treaty that proposes that a carbon price of $50 to apply globally! A 4% green tariff is hardly worth worrying about considering tariffs used to be much much higher than that.
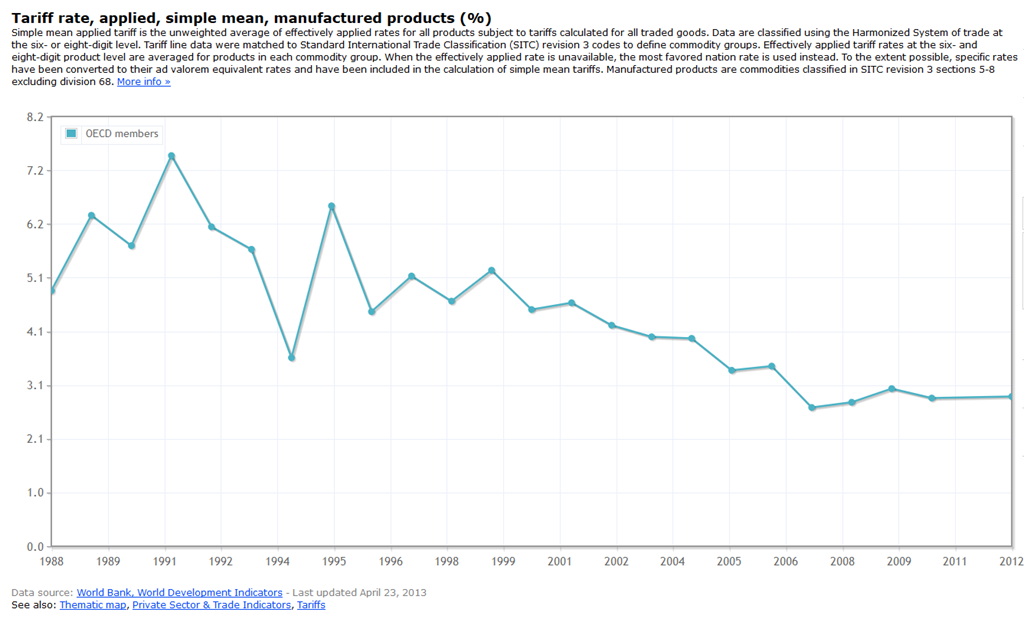
Given all the stories of why woe and doom touted out by the climate alarmists, climate salvation and the keys to environmental heaven should cost much more than 4% tax?! Your sins are forgiven for a 4% green tariff! Big problems such as a climate crisis are not solved with a 4% green tariff.
I think this green tariff of 4% is an own goal. It reinforces the clear message from the economics of climate change that global warming is actually a small economic problem not a large one.
For developed countries, global warming will be at most a minor irritant. For developing countries, their best solution and the solution they have most control over is to develop faster and become a developed country.
In which Anglo-Saxon country is full-time work not enough to escape family poverty on the minimum wage?
07 Jun 2015 1 Comment
in labour economics, minimum wage, politics - Australia, politics - New Zealand, politics - USA, population economics, poverty and inequality, welfare reform Tags: earned income tax credit, poverty traps, single parents, taxation and the labour supply, welfare state
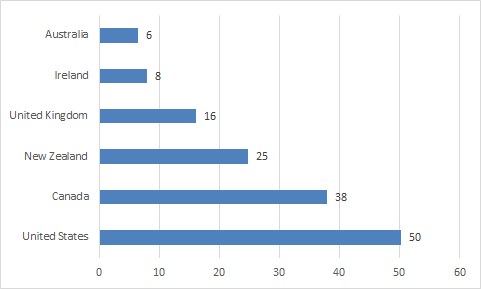
Figure 1: Weekly working hours needed at minimum-wage to move above a 50% relative poverty line after taxes, mandatory social or private contributions payable by workers, and family benefits for lone parent with two children, Anglo-Saxon countries, 2013
Supply-side economics and the migration of inventors
07 Jun 2015 Leave a comment
in applied price theory, entrepreneurship, fiscal policy, human capital, labour economics, labour supply, occupational choice, politics - Australia, politics - New Zealand, politics - USA Tags: economics of migration, taxation and the labour supply
#Braindrain is real, even quantifiable — as per NBER paper 21024. Geniuses don't tolerate extra taxes easily. http://t.co/HVP8uEFAfz—
Amity Shlaes (@AmityShlaes) June 07, 2015
Now what was it that the Nordics had over New Zealand in education?
05 Jun 2015 Leave a comment
in economics of education, politics - New Zealand Tags: education spending, Finland, Iceland, Nordic countries, Norway, Scandinavia, Sweden, teacher pay
Economists are actually centre-left but are conservative compared to anthropologists
04 Jun 2015 Leave a comment
in economics, labour economics, occupational choice, personnel economics, politics - Australia, politics - New Zealand, politics - USA Tags: academic bias, voter demographics
Verdant Labs published charts on the average political affiliations of various professions. Data from the Federal Election Commission on contributions to political parties was used that information as a proxy for political views. The ratios are Democrats (blue) vs. Republicans (red).

via Chart: The most liberal and conservative jobs in America – The Washington Post.
John Key’s 2017 tax cuts will not be “modest”
04 Jun 2015 3 Comments
in economic growth, politics - New Zealand, Public Choice, public economics

Bill English’s 2015 New Zealand Budget foreshadows a $1.5 billion allowance in the 2017 budget for “modest tax cuts”. Any reasonable mock-up of these tax cuts, such as in table 1 using the numbers on the Treasury website for revenue losses for small tax changes show that Prime Minster Key is planning his own fistful of dollars in the lead up to the 2017 election.
Table 1: hypothetical 2017 National Party tax cuts, $1.5 billion
| Current tax rate | New tax rate | Revenue loss, static scoring |
Revenue loss, dynamic scoring |
| 33% | 31.5% | $323m | $274m |
| 30% | 27.5% | $388m | $329.4m |
| 17.5% | 16.5% | $505m | $429.3m |
| Trust tax 33% | Trust tax 31.5% | $135m | $129m |
| Company tax rate 28% | 27.5% | $113m | $90m |
| Total cost | $1.465b | $1251m |
No serious participant in public policy debate could suggest that tax cuts of the size in table 1 will not have incentive effects that will lead to growth in incomes and business profits. There will be offsetting tax revenue increases that make a more ambitious tax package possible in 2017.
The Treasury’s website on revenue losses forecasts that a 1% increase in wages growth will increase tax revenue by $300 million. A 1% increase in the growth rate of taxable business profits will increase tax revenues by $140 million again according to the Treasury. These are big differences.
Any sensible discussion of the 2017 tax cuts should be against a background of what is called dynamic scoring to use the American parlance.
When the NZ Treasury “scores” revenue losses from tax cuts on its website, its estimates of revenue changes assume no changes in behaviour. Dynamic scoring takes behavioural effects into account.
The Congressional Budget Office was recently required to use dynamic scoring when costing major tax policy proposals. New Zealand should follow this path.

Table 2 makes conservative assumptions about the behavioural effects of income tax cuts. I follow Mankiw, N. Gregory and Matthew Weinzierl “Dynamic Scoring: A Back-of-the-Envelope Guide,” Journal of Public Economics (September 2006): 1415-1433. They argue that, in the long run, about 17% of a cut in individual income taxes is recouped through higher economic growth. For a cut in company taxes, their figure is 50%. I assume 15% is recouped in this way for individuals, 20% for companies and 5% for trusts.
Table 2: hypothetical 2017 National Party tax cuts, $1.5 billion, dynamic scoring of revenue effects
| Current tax rate | New tax rate | Revenue loss static Scoring |
Revenue loss dynamic scoring |
| 33% | 31% | $430m | $366m |
| 30% | 27% | $465m | $395m |
| 17.5% | 16.5% | $505m | $429m |
| Trust tax 33% | Trust tax 31% | $180m | $171m |
| Company tax rate 28% | 27% | $225m | $180m |
| Total cost | $1.805b | $1.541b |
The $200-300 million in revenue increases from higher incomes and higher business profits incentivised by lower tax rates is not a trivial sum. It is enough on its own to cut one percentage point of the company tax rate. Spread around as in table 2, there are enough to knock another one-half of a percentage point of the top tax rate, the second top tax rate and the company tax rate. The $1.5 billion in tax cuts planned for 2017 will be neither modest in their size nor in their behavioural effects.
No budget should be published and no party in an election should assert that large changes in the tax system have no behavioural effects. Dynamic scoring makes a big difference to what scale of tax cuts are possible.
There are practical hurdles to dynamic scoring but static scoring has more important ones. The hurdles of dynamic scoring are:
- Economists do not know how to accurately measure the growth effects of most policies
- Dynamic scoring relies on less-than-accurate, theory-based macro models
- The macro models undergirding dynamic scoring have numerous controversial and unproven built-in assumptions
- The assumptions embedded in the macro models are not always carefully empirically based
- Macro models exclude theoretically and empirically supported evidence of supply-side effects of public investment
- Macro models exclude evidence-based effects of economic inequality
- Macro models exclude evidence-based effects of numerous policies
- Macro models provide different estimates of growth impacts of policy depending on guesses of how the policy may be finance
Against that is dynamic scoring removes the bias against pro-growth policies in current budgetary scoring:
[A] theoretical advantage of accurate dynamic scoring is that it is not biased against pro-growth policies compared to the current conventional scoring method. By ignoring macroeconomic effects, the conventional method overstates the true budgetary cost of pro-growth policies, such as infrastructure investments, and understates the cost of anti-growth policies.
To close on some New Zealand politics, Prime Minister Key, who is known as the smiling assassin, overtook the Labour Party and the Greens on their left In the 2015 Budget by increasing welfare benefits for the first time since 1972 in real terms, and by a large amount ($25 a week), and also increasing family tax credits.
Prime Minister Key well then pivot to the right in 2017 with a fistful of dollars to firmly camp himself over both the centre-left in the centre-right to be re-elected for a fourth term against an increasingly hapless and out-manoeuvred opposition.
Unions have been on the way out for a long time
03 Jun 2015 Leave a comment
in economic history, labour economics, politics - Australia, politics - New Zealand, politics - USA, unions Tags: the withering away of the proletariat, union power, union wage premium
The economics of low wages: When what comes down doesn’t go up econ.st/1zlP1G0 http://t.co/AujgeDIAUX—
The Economist (@EconEconomics) May 02, 2015


Recent Comments