
More on the emergence of Generation Rent in New Zealand
28 Sep 2016 Leave a comment
in applied welfare economics, economic history, politics - New Zealand, urban economics Tags: Generation Rent, housing affordability

Spot Generation Rent in New Zealand
25 Sep 2016 Leave a comment
in economic history, politics - New Zealand, urban economics Tags: Generation Rent, housing affordability

Source: Housing affordability: The Social Report 2016 – Te pūrongo oranga tangata from Perry (2015), Ministry of Social Development, using data from Statistics New Zealand’s Household Economic Survey.
Next to nobody rents in Romania! The European League of Home Ownership
10 Feb 2016 Leave a comment
in urban economics Tags: EU, Generation Rent, homeownership, housing prices, Romania
The emergence of generation rent in the USA and UK
28 Nov 2015 1 Comment
in urban economics Tags: Generation Rent, housing prices
No Generation Rent in Deutschland or Nihon? Housing price to income ratios, USA, UK, Japan, Germany and New Zealand
27 Nov 2015 Leave a comment
in economic history, urban economics Tags: Generation Rent, housing affordability, housing prices
Japan and Germany seem to be pretty relaxed places to buy a house over the last 15 years. The USA had a bit of a bubble but it burst. New Zealand and the UK are dogs of places if you are young and house-hunting.
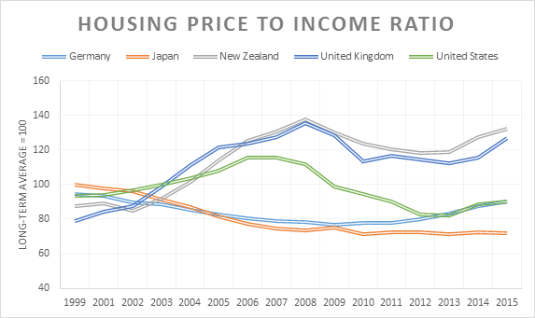
Source: OECD Economic Outlook November 2015, Annex Table 61.
Generation Rent comes to Scandinavia in lockstep – real housing prices in #Finland, #Sweden & #Norway since 1975
17 Sep 2015 Leave a comment
in economic history, urban economics Tags: Finland, Generation Rent, housing affordability, housing prices, land supply, land use planning, NIMBYs, Norway, Sweden, zoning

Source: International House Price Database – Dallas Fed
Note: The house price index series is an index constructed with nominal house price data. The real house price index is an index calculated by deflating the nominal house price series with a country’s personal consumption expenditure deflator.
No Generation Rent in #Nihon – real housing prices in #Japan and #SouthKorea since 1975
16 Sep 2015 Leave a comment
in development economics, economic history, growth miracles, urban economics Tags: Generation Rent, housing affordability, housing prices, Japan, land supply, land use planning, NIMBYs, South Korea, zoning

Source: International House Price Database – Dallas Fed
Note: The house price index series is an index constructed with nominal house price data. The real house price index is an index calculated by deflating the nominal house price series with a country’s personal consumption expenditure deflator.
No Generation Rent in #Deutschland! Real housing prices in #Germany, #France & #Italy since 1975
14 Sep 2015 Leave a comment
in economic history, urban economics Tags: France, Generation Rent, Germany, housing affordability, housing prices, Italy, land supply, land use planning, NIMBYs, zoning

Source: International House Price Database – Dallas Fed
Note: The house price index series is an index constructed with nominal house price data. The real house price index is an index calculated by deflating the nominal house price series with a country’s personal consumption expenditure deflator.
The rapid emergence of Generation Rent in the UK and New Zealand
17 Apr 2015 1 Comment
in politics - New Zealand, urban economics Tags: Generation Rent, housing affordability, land supply restrictions, UK politics, zoning

I thought I should reproduce this chart for New Zealand to show the extent to which a Generation Rent has emerged in New Zealand in the last 10 years.


Source: 2013 Census QuickStats about housing.
Might be more interesting to breakdown the pie charts as a single time series for 25 to 29 and 30 to 34 year-olds as the latter are more likely to be settling down and buying a house.
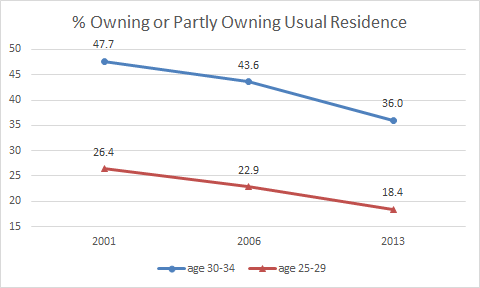
Source: 2013 Census QuickStats about housing.
The number of New Zealanders who own or partly owned their residence in the really 30s has dropped from almost one in two falling towards one in three since 2001. Generation Rent is very much the majority of New Zealanders aged 30 to 34.
For those New Zealanders aged 25 to 29, instead of one in four at least partly owning their residences, as was the case in 2001, the number of those aged 25 to 29 buying or owning their own house has dropped to less than one in five.
Generation Rent for those aged 25 to 29 has gone from a majority tendency to the dominant state for those in their late 20s. In both cases, the emergence of Generation Rent has sped up since 2006.

The emergence of generation rent coincided with a sharp increase in prices in real terms in New Zealand while housing prices against rents became far less competitive.

HT: Global house prices: Location, location, location | The Economist.
.
The poor are losing out most in the Generation Rent class struggle
01 Apr 2015 Leave a comment
in labour economics, poverty and inequality, urban economics Tags: Generation Rent


Sorry @WJRosenbergCTU the class war has been based on a measurement error! The real class enemy is the RMA and restricted land supply – updated again
21 Mar 2015 Leave a comment
in applied welfare economics, comparative institutional analysis, Marxist economics, politics - Australia, politics - New Zealand, politics - USA, poverty and inequality, urban economics Tags: Class war, Generation Rent, housing affordability, housing prices, land use regulation, RMA, Thomas Picketty, top 1%, wage stagnation
The other day, I replied to a rant by Bill Rosenberg about the decline in labour share of national income and its implications for income inequality and the great wage stagnation. The labour share of national income has dropped by at least 5% in most countries including New Zealand.

New data from the USA has found that the entire declining the value of the share of labour of national income is due to home ownership:
…the net capital share has increased since 1948, but when disaggregated this increase comes entirely from the housing sector: the contribution to net capital income from all other sectors has been zero or slightly negative, as the fall and rise have offset each other.
The capital share is rising because of the increased value of housing in countries with widespread home ownership. The concentration of capital ownership and wealth in the top 1% was a misplaced concern based on measurement error.
https://twitter.com/EconBizFin/status/581047721836060672
Piketty assumed the returns to capital were increasing across the entire economy. Rognlie found the trend to be almost entirely isolated to the housing sector. His 23 page long conference paper at the Brookings Institution started as a comment on a blog post on Marginal Revolution.

When Rognlie adjusted for the rapid depreciation inherent to investments in capital such as computer software, most of the rest of the increase in the capital share in recent decades in the USA and six other countries has came in housing.

A single sector such as housing is not the force that is shaping past and future of inequality as Piketty and others such as Bill Rosenberg in New Zealand have assumed. They attributed a growing share of income going to capital across the board as Tyler Cowan explains.
In the simplest version of the Piketty model, wealth grows more quickly than does the economy as a whole and thus the picture changes. The relative losers are no longer low earners but rather anyone who is not a capitalist. Any disparity is due not to their shortcomings in labour markets but rather to their lack of a high initial endowment.
The main driver of inequality is the tendency of returns on capital to exceed the rate of economic growth and company shares, businesses and other capital are owned by a narrow section of the community, and in particular by the top 1% of income earners. Trends in housing prices and the comings and goings of intangible capital is not part of that story.

Investment and depreciation of software and other intellectual property is not well handed, or even well measured in current national accounting systems as Edward Prescott has shown in a long research programme dating back 10 years. Intangible capital produced and owned by businesses is known to be big part of all investment in the economy but nearly all of it is recorded as an expense and therefore most is not part of GDP as currently measured.

Source: Edward C. Prescott and Ellen R. McGrattan (2014)
Prescott estimated the value of intangible capital to be equal to about 60% of that of tangible capital in the US economy. Incorrect treatment of investment in intangible capital seriously underestimates investment, output, fluctuations in labour productivity and movements in the capital shares. The graph above shows that the recently introduced intellectual property classification in the US national accounts is both large and volatile relative to equipment and structures investments over the last 40 years. The graph below shows that including intangible capital completely changes the predictions of real business cycle models about trend US labour productivity in the 1990s.
Labor Productivity, for the Model, With and Without Intangible Investment (Real, Detrended) 1990-2003
Source: McGrattan and Prescott, 2005, “Expensed and Sweat Equity,” Research Department Working Paper 636, Federal Reserve Bank of Minneapolis.
This depreciation adjustment for software investment is important because you can’t eat depreciation, as a shrewd observer noted. The rapid depreciation of software is depreciation – it cannot be redistributed from the top 1% to the downtrodden workers as some sort of income. Others have also earlier argued that Piketty’s claims rest on the recent increase in the price of housing.

The main reason for increases in the price of housing in New Zealand and elsewhere is restrictions on the supply of land by local councils. They are the real class enemy.

The metropolitan urban limit in Auckland increases land prices by 9 fold just inside that limit. As Tim Taylor said today:
The rise in capital income as a result of a long-term rise in land and housing prices across the high-income countries is a phenomenon that isn’t easily crammed into the usual disputes over whether capital owners are exploiting wage-earners.
The role of the housing sector and restrictions on land supply driving up housing prices in recent decades in shaping the future of inequality is perhaps underplayed given the many discussions of Generation Rent.

Housing affordability is a real crisis in New Zealand and many other countries with the younger generation no longer able to buy a house. They are condemned to decades of renting a house. They may never be able to afford a house on one income and perhaps two ordinary comes.
The future of inequality is between those who can and cannot afford a dream and a right for their parents and grandparents, which was to buy a house and pay the mortgage off within a couple of decades.

Young people used to buy a house shortly after leaving university and paid it off by their middle age when I was in my 20s and 30s. Back then, which was not all that long ago, ordinary workers could aspire to take out a mortgage and buy a house in the suburbs.

Unless there is a major deregulation of the supply of land in the big cities, home ownership for most in the community will really be a dream, rather than a dream of aspiration achieved by most by their 30s, if not often earlier through working and saving. The grandchildren of the baby boomers will become and perhaps already are Generation Rent.

Recent Comments