The Greenpeace vandals who trespassed at Parliament, climbing up to put signs down the front in flagrant disregard of the most ample possible options for peaceful protest right outside at least had the integrity to plead guilty. That shows some sort of fidelity to law and an acknowledgement that what they did was a criminal offence.
John Rawls makes the point that the purpose of civil disobedience is not to impose your will upon others but through your protest to implore them to reconsider their position and change the law or policy you are disputing.
Rawls argues that civil disobedience is never covert or secretive; it is only ever committed in public, openly, and with fair notice to legal authorities. Openness and publicity, even at the cost of having one’s protest frustrated, offers ways for the protesters to show their willingness to deal fairly with authorities. Rawls argues:
for a public, non-violent, conscientious yet political act contrary to law being done (usually) with the aim of bringing about a change in the law or policies of the government;
that appeals to the sense of justice of the majority;
which may be direct or indirect;
within the bounds of fidelity to the law; and
whose protesters are willing to accept punishment. Although civil disobedience involves breaking the law, it is for moral rather than selfish reasons; the willingness to accept arrest is proof of the integrity of the act.
Rawls argues, and too many forget, that civil disobedience and dissent more generally contribute to the democratic exchange of ideas by forcing the champions of dominant opinion to defend their views.
Legitimate non-violent direct action are publicity stunts to gain attention and provoke debate within the democratic framework, where we resolve our differences by trying to persuade each other and convince the electorate.
Too many acts of non-violent direct action aim to impose their will on others rather than peaceful protests designed to bring about democratic change in the laws or policies of the incumbent government. That ‘might does not make right’ is fundamental to the rule of law. As United States Supreme Court Justice Antonin Scalia said
The virtue of a democratic system [with a constitutionally guaranteed right to free speech] is that it readily enables the people, over time, to be persuaded that what they took for granted is not so and to change their laws accordingly..
Both sides passionately but respectfully attempt to persuade their fellow citizens to accept their views. Win or lose, advocates for today’s losing causes can continued pressing their cases, secure in the knowledge that an electoral loss today can be negated by a later electoral win, which is democracy in action as Justice Kennedy explains:
…a democracy has the capacity—and the duty—to learn from its past mistakes; to discover and confront persisting biases; and by respectful, rationale deliberation to rise above those flaws and injustices…
It is demeaning to the democratic process to presume that the voters are not capable of deciding an issue of this sensitivity on decent and rational grounds.
The process of public discourse and political debate should not be foreclosed even if there is a risk that during a public campaign there will be those, on both sides, who seek to use racial division and discord to their own political advantage. An informed public can, and must, rise above this. The idea of democracy is that it can, and must, mature.
Freedom embraces the right, indeed the duty, to engage in a rational, civic discourse in order to determine how best to form a consensus to shape the destiny of the Nation and its people. These First Amendment dynamics would be disserved if this Court were to say that the question here at issue is beyond the capacity of the voters to debate and then to determine.
John Rawls’ view that fidelity to law and democratic change through trying to persuade each other is at the heart of civil disobedience reflects the difference between the liberal and the left-wing on democracy and social change as Jonathan Chait observed this week:
Liberals treat political rights as sacrosanct. The left treats social and economic justice as sacrosanct. The liberal vision of political rights requires being neutral about substance.
To the left, this neutrality is a mere guise for maintaining existing privilege; debates about “rights” can only be resolved by defining which side represents the privileged class and which side represents the oppressed…
Liberals believe that social justice can be advanced without giving up democratic rights and norms. The ends of social justice do not justify any and all means.
Were the Greenpeace runabouts observing maritime safety rules such as avoiding collisions and giving way? Any protester that behaved like that in a car would be immediately arrested and charged.
Why it is tolerated in the high seas is beyond me when it would never be tolerated on the road. No one would pretend reckless driving was peaceful protest. Is it okay to behave recklessly in a boat? No one would accept that in a car on land.
Activists dangling. Police removed support people on bridge. Huge law enforcement presence in water plus kayactivists pic.twitter.com/vqYGdNH67y
Central to the notion of peaceful protest is fidelity to democracy and the rule of law. The idea is not to impose your will upon others, but to persuade the majority to reconsider their position by showing the passionate extent to which you disagree with them and honestly believe they are mistaken.
The civil disobedient is attempting to appeal to the “sense of justice” of the majority and a willingness to accept arrest is proof of the integrity of the act says Rawls:
…any interference with the civil liberties of others tends to obscure the civilly disobedient quality of one’s act.
Rawls argues that the use or threat of violence is incompatible with a reasoned appeal to fellow citizens to move them to change a law. The actions are not a means of coercing or frightening others into conforming to one’s wishes. That is a breach of the principles of a just society.
Rising inequality has been the norm in most developed countries, but few have seen it increase by as much as New Zealand.
Since the 1980s, New Zealand’s inequality – which had been low by OECD standards – drew closer to levels seen in more unequal countries like the United States.
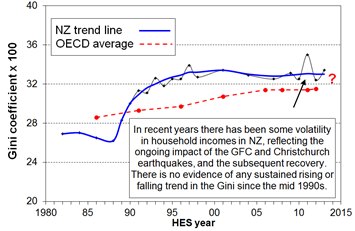
They support this claim with a Gini Coefficient chart that I’ve been unable to source at the OECD. I therefore use another that is freely available in New Zealand and which I have used in the past. My data source on the Gini coefficient has the advantage of been a complete series back to the early 1980s rather than five yearly observations in the OECD data sourced by the Dominion Post.
Figure 1: Inequality in New Zealand and the OECD trend: the Gini coefficient
Source: Bryan Perry, Household incomes in New Zealand: Trends in indicators of inequality and hardship 1982 to 2013. Ministry of Social Development (July 2014), Figure J5.
Figure 1 shows there is no evidence of a substantive rise or fall in inequality in New Zealand since the mid 1990s. Nearly all of the increase in inequality was in the late 1980s and early 1990s. Not mentioning that nearly all of the increase was in a short period leads to a poor understanding of the data before their readers. Rising inequality is not an on-going problem in New Zealand. There was a large rise in inequality in the late 1980s and early 1990s.
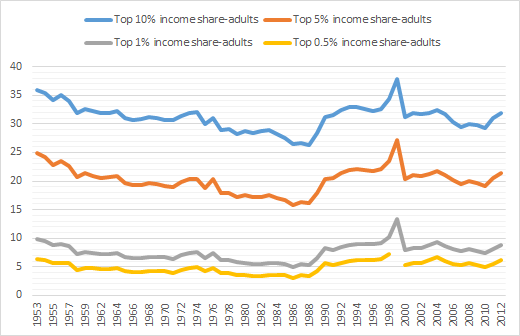
The next figure that I’ve been able to reproduce is the income shares of the top 10%, top 5%, top 1% on top 0.5% income earners in New Zealand – see figure 2.
Our intrepid reporters in the Dominion Post claim that figure 2 shows that:
In 1986, the top 10 per cent took home 26.5 per cent of New Zealand’s income. In 1999, it was 37.8 per cent and in 2004, it was 33.2 per cent.
Oddly enough, our intrepid reporters decided to stop at 2004 for no particular reason. They also chose to truncate their chart at 1986 for no particular reason other than to lead the coincidence that the top 10% income shares were higher in the 1960s and 1970s that now– see figure 2 . That is, the top 10% in New Zealand earned more in the days before the scourge of neoliberalism came upon the New Zealand then after it – see figure 2. This detail was worth disclosing. Did neoliberalism reduce the income divide in New Zealand between the top 10% and the rest? Figure 2 suggests that it did.
The best that veteran grumbler Max Rashbrooke could spin to make these good old days of higher inequality than now to look like good old days before the scourge of neoliberalism beset New Zealand was to ignore the fortunes of the majority of the population in his dewy eyed view of his childhood:
New Zealand up until the 1980s was fairly egalitarian, apart from Māori and women, our increasing income gap started in the late 1980s and early 1990s
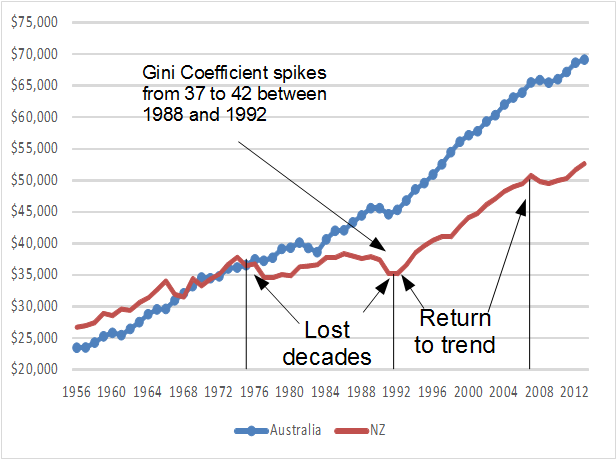
A more worthy analysis of figure 2 is to note that top income shares in New Zealand haven’t changed that much except for a bit of a spike in the late 1980s. This increase in inequality in New Zealand in the late 1980s and early 1990s – see figures 1 and 2 – was quickly followed by a long economic boom – see figure 3.
Figure 3: Real GDP per New Zealander and Australian aged 15-64, 2014 US$ (converted to 2014 price level with updated 2011 PPPs), 1.9 per cent detrended, 1956-2013
This boom after next to two decades of minimal real economic growth per working age New Zealander benefited everyone and, for example, the unemployment rate fell to a record low of 3.5% about 2005. The supposedly more egalitarian 1970s and 1980s were lost decades of growth – see figure 3.
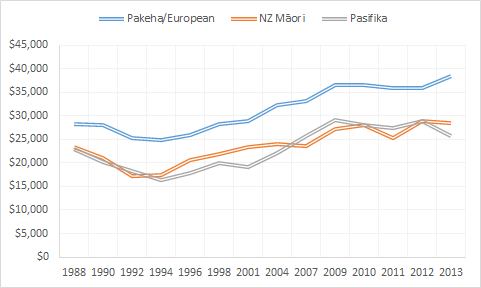
Figure 4: Real equivalised median household income (before housing costs) by ethnicity, 1988 to 2013 ($2013)
Source: Bryan Perry, Household incomes in New Zealand: Trends in indicators of inequality and hardship 1982 to 2013. Ministry of Social Development (July 2014).
As shown in figure 4, between 1994 and 2010, real equivalised median New Zealand Pakeha household income rose by 47%; for Māori, this rise was 68%; for Pasifika, the rise in real equivalised median household income was 77%. These trends pass the difference principle developed by John Rawls.
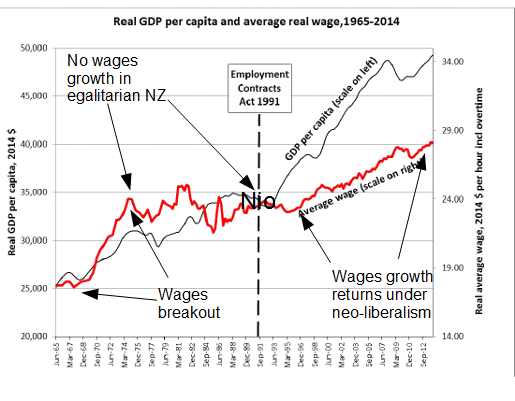
The large improvements in Māori incomes since 1992 were based on rising Māori employment rates, fewer Māori on benefits or zero incomes, more Māori moving into higher paying jobs, and greater Māori educational attainment (Dixon and Maré 2007). Labour force participation rates of Māori increased from 45% in the late 1980s to about 62% in the last few years. Māori unemployment reached a 20-year low of 8 per cent from 2005 to 2008. That and the return of wages growth after years of stagnation as shown in figure 5 is something to celebrate.
Figure 5: real GDP per capita an average real wage, 1965 – 2014, New Zealand
The reporters in the Dominion Post also fell for the recent OECD analysis suggesting a connection between economic growth and inequality:
One study by the OECD suggests rising inequality was responsible for wiping a third off New Zealand’s economic growth in the past 30 years
It estimated the rate of New Zealand’s GDP growth was stunted by as much as 15.5 percentage points between 1990 and 2010 – more than any other OECD economy.
The analysis of the OECD depended crucially upon how greater inequality reduces the ability of the lower income families to invest in human capital:
The evidence strongly suggests that high inequality hinders the ability of individuals from low economic background to invest in their human capital, both in terms of the level of education but even more importantly in terms of the quality of education.
The OECD theory of inequality and lower growth is there is a financing constraint because of inequality that reduces economic growth because of less human capital accumulation by lower income families.
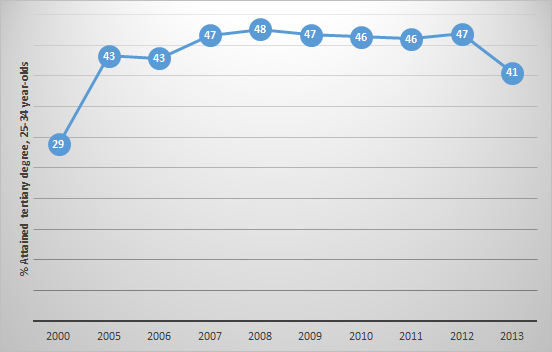
The OECD put a lot of their growth inequality nexus eggs in one basket. The OECD was implying that student loans and other government interventions are not closing credit constraints on financing higher education despite decades of rapidly rising tertiary education attainment, which is partially illustrated in figure 6.
This is interesting because in 2002, with Pedro Carneiro, James Heckman showed that lack of credit is not a major constraint on the ability of young Americans to attend college. They found that credit constraints prevent, at most, 4% of the U.S. population from attending. Credit constraints is weakening as a rationale for a lack of an accumulation of human capital, and can be easily solved.
Another difficulty for the OECD is the increase in inequality in New Zealand was, as noted before in figures 1 and 2, in the late 1980s and 1990s. To blame low economic growth to the tune of 15 percentage points on events of some 25 or 30 years ago is a long bow.
Higher education has been free for the low income families for several generations. Student loans are readily available. It is hard to believe that such a readily solvable problem is a major source of inequality and lower growth. Moreover, as Aghion said:
Economists and others have proposed many channels through which education may affect growth–not merely the private returns to individuals’ greater human capital but also a variety of externalities.
For highly developed countries, the most frequently discussed externality is education investments’ fostering technological innovation, thereby making capital and labour more productive, generating income growth.
Despite the enormous interest in the relationship between education and growth, the evidence is fragile at best.
The 15 percentage point reduction in New Zealand economic growth since the late 1980s because of inequality is so large over a 30 year period that this half a percentage point reduction on average per annum qualifies as an independent source of business cycle shocks and an equally implausible driver of real business cycles.
Our intrepid reporters closed by claiming large increases in child poverty:
In December last year, the second annual Child Poverty Monitor showed a slight decrease in the number of Kiwi children living in income poverty, from 27 per cent to 24 per cent. But 30 years ago, it was 14 per cent.
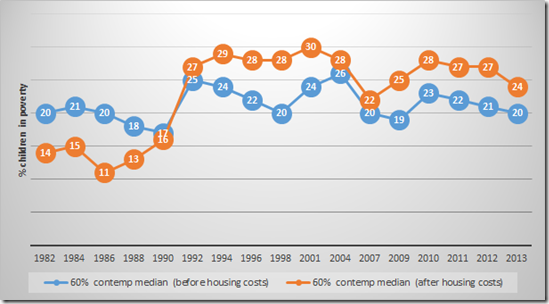
Figure 7 below shows their numbers, which is child poverty in New Zealand for poverty thresholds of 60% relative to a contemporary median measured both before and after housing costs.
Figure 7: % child poverty in New Zealand (before and after housing costs), 60% relative to contemporary median, 1982 – 2013
Source: Bryan Perry, Household incomes in New Zealand: Trends in indicators of inequality and hardship 1982 to 2013. Ministry of Social Development (July 2014), Tables F.6 and F.7.
The first thing to notice in figure 7 is before housing costs child poverty has been pretty stable for 30 years the New Zealand. Few celebrate this.
Figure 7 does show a large increase in after housing costs child poverty in the late 1980s. Since the early 1990s, after housing costs child poverty has slowly tapered down from the high 30% in the mid-1990s to 24% now – see figure 7.
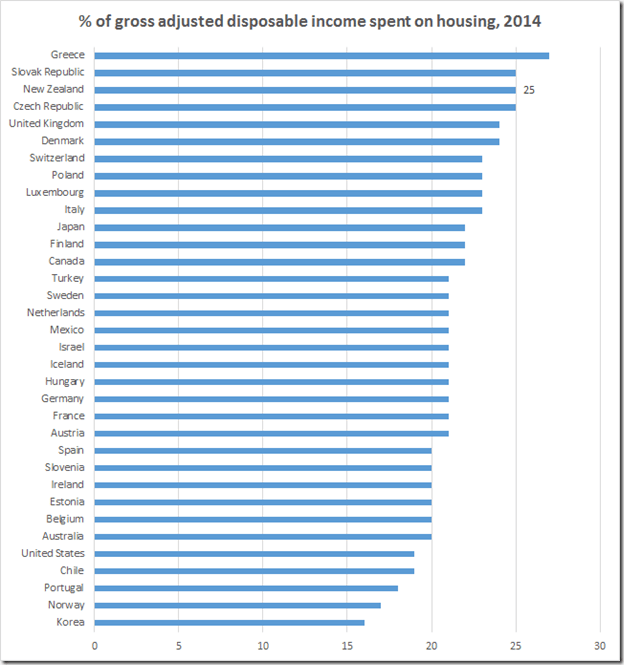
In the longer run after housing costs child poverty rates in 2013 were close to double what they were in the late 1980s mainly because housing costs in 2013 were much higher relative to income than they were in the late 1980s.
– Bryan Perry, 2014 Household Incomes Report – Key Findings. Ministry of Social Development (July 2014).
Before housing costs child poverty in recent years as been the same as it was in 1982 – see figure 7. Although there were large cuts in the social security benefits in the 1991 mother of all budgets in New Zealand, before housing child poverty increased to 25% but was back to 20% by the mid 1990s.
As figure 7 shows, the problem was not income, but the rising costs of housing that had to be paid out of benefits and wages. The Left over Left will not let go of the 1991 benefit cuts even 25 years later despite the fact that the issue was rising housing costs rather than perpetually higher before housing costs child poverty.
The problem is not income, it is rising costs of housing. Increasing wages and benefits will not solve that if more money is simply chasing the same limited stock of land and urban housing.
A proper comparison of the diverging trends in figure 7 between before housing costs child poverty and after housing costs child poverty rates since 1982 gives a much clearer picture of what is increasing child poverty. It is rising housing costs as a result of regulation on the supply of new urban land.
The driver of inequality in New Zealand is government regulation of the land supply – policies supported by the middle-class and the left-wing parties. Rising inequality is not inequality between high and low income earners as suggested by the Dominion Post.
Brad DeLong set up a thought experiment to work out if we were better off than in the good old days. He asked how much money would you want to take with you if you had to step into a time machine to go back to some specific point in time and not be worse off for the trip in living standards and life expectancy. He was writing in 1995, talking about going back to 1895.
John Rawls asks a similar question by saying what type of society would you to agree to in a social contract if you’re behind a veil of ignorance. You didn’t know where you were going to be in society behind the veil of ignorance.
All you know you is you will be some random member of that society, at the top, bottom or somewhere in between.
…no one knows his place in society, his class position or social status; nor does he know his fortune in the distribution of natural assets and abilities, his intelligence and strength, and the like.
What social institutions would you agree in that society given you don’t know where you will be in it?
John Rawls also said that the society was fair if you didn’t mind showing up somewhere in it as a random member.
Let’s suppose a thought experiment which combines a time machine with a veil of ignorance:
Alien proctologists from outer space take time off from kidnapping rednecks at closing time at pubs to kidnap you instead;
After probing your nether regions, but before flying off to light years away where they came from without any further earthly contact they offer you the option of beaming back to where you came from but with a twist in time;
You can beam back to be a random member of your current society or a random member of a society in the past of your choice; but
Random reassignment to either the present or a past of your choosing are your only options as the alien kidnap victim.
Behind that inter-temporal veil of ignorance, would you choose to be a random member of your own society or prefer to beam back in time to before the ravages of neoliberalism destroyed the good old days?
Why Evolution is True is a blog written by Jerry Coyne, centered on evolution and biology but also dealing with diverse topics like politics, culture, and cats.
In Hume’s spirit, I will attempt to serve as an ambassador from my world of economics, and help in “finding topics of conversation fit for the entertainment of rational creatures.”








Recent Comments