
Data extracted on 30 Jan 2016 03:32 UTC (GMT) from OECD.Stat.
Celebrating humanity's flourishing through the spread of capitalism and the rule of law
01 Feb 2016 Leave a comment
in politics - Australia, politics - New Zealand, politics - USA, public economics Tags: Australia, Canada, Denmark, France, Germany, Italy, Japan, Social Security taxes, taxation and labour supply, the dish economy
31 Jan 2016 Leave a comment
in politics - Australia, politics - New Zealand, politics - USA, public economics Tags: Australia, British economy, Canada, Denmark, France, Germany, Italy, Japan, New Zealand, social insurance, Social Security taxes, taxation and labour supply
Ordinary French, Germans, Italians and Danish pay much higher marginal tax rates and that is before their high rates of GST.

Data extracted on 30 Jan 2016 03:08 UTC (GMT) from OECD.Stat.
27 Jan 2016 Leave a comment
in population economics, urban economics Tags: Australia, geography
26 Jan 2016 Leave a comment
in politics - Australia, politics - New Zealand, politics - USA, public economics Tags: Australia, earned income tax credit, family tax credits, family taxation, in-work tax credits, working for families
26 Jan 2016 Leave a comment
in economics of media and culture Tags: Australia, maps
Do not underestimate the size of Australia http://t.co/K1DwtnObyg—
Amazing Maps (@amazinmaps) February 09, 2015
08 Jan 2016 Leave a comment
in economic history, human capital, labour economics, politics - Australia, poverty and inequality Tags: Australia, superstar wages, superstars, top incomes, working rich
Over the course of the post-war period top incomes in Australia turned into top wage earners. It is unfortunate that information is not available on the extent to which business incomes make up the balance of top incomes as distinct from dividend incomes.

Source: The World Wealth and Income Database.
08 Jan 2016 2 Comments
in applied price theory, economic history, politics - Australia, politics - New Zealand, politics - USA, poverty and inequality Tags: Australia, Leftover Left, top 1%
What slackers. Despite 30 years of neoliberalism oppressing the unions and working class, the top 1% in New Zealand (and Australia) are unable to do any better in terms of their share of national income than in the good old days of pre-1984 New Zealand looked upon with such fondness by the the Leftover Left.

Source: The World Wealth and Income Database.
27 Nov 2015 Leave a comment
in economic history Tags: Age of exploration, Australia, New Zealand
15 Nov 2015 1 Comment
in applied welfare economics, economic growth, economic history, economics of regulation, fiscal policy, labour economics, politics - New Zealand Tags: Australia, John Quiggin, lost decades
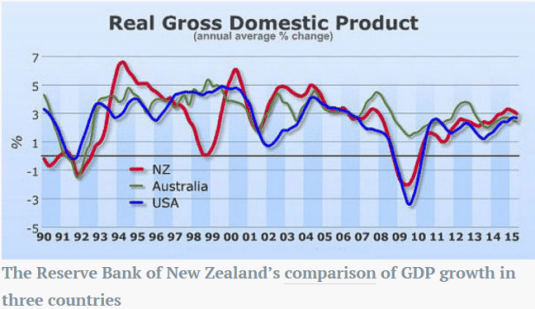
Leading Australian academic economist John Quiggin has just published an article arguing that New Zealand should not be a policy role model for anything. To quote Quiggin:
For most of the twentieth century, the New Zealand and Australian economies performed almost identically. New Zealand took a somewhat larger hit when Britain entered the European Common Market in the 1970s, but that impact has long since washed out. The real divergence came in the 1980s. Since then, New Zealand’s income per person has fallen 35 per cent behind Australia’s
He used Reserve Bank of New Zealand data going back to 1990, which is common starting point for most Reserve Bank data.
Source: John Quiggin “How New Zealand fell further behind”. Inside Story, 11 November 2015.
If he had taken that chart back to the 1970s and earlier using the Conference Board Total Database, Quiggin would have found that New Zealand economy diverged from Australia in the 1970s, not in the 1980s. His data from the Reserve Bank of New Zealand started at the low point in 1990 – at the end of that divergence that started in 1974. The New Zealand economy was depressed between 1974 and 1992. I label this Great Depression in New Zealand as New Zealand’s Lost Decades.
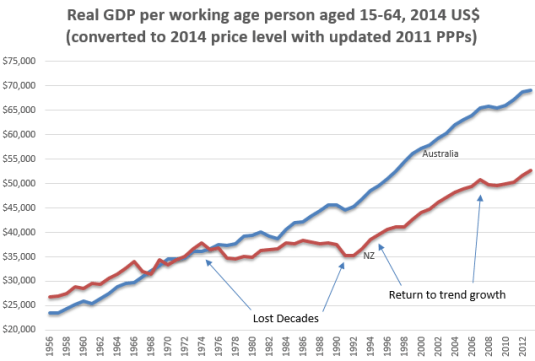
Source: Computed from OECD Stat Extract and The Conference Board. 2015. The Conference Board Total Economy Database™, May 2015, http://www.conference-board.org/data/economydatabase/
Real GDP PPP per working age New Zealander fell rapidly after 1974 (a 34% drop against trend) when that economy was a heavily regulated, highly taxed economy. This heavily regulated, highly taxed, economically stagnant New Zealand is the good old days in the eyes of the Twitter Left.
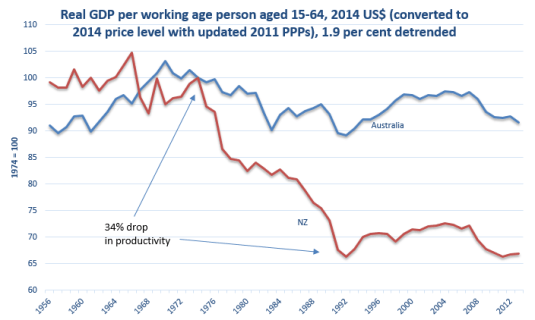
Source: Computed from OECD Stat Extract and The Conference Board. 2015. The Conference Board Total Economy Database™, May 2015, http://www.conference-board.org/data/economydatabase/
In the chart above, the base is 1974 which equals 100. A flat-line means annual growth equal to the trend rate of growth in the 20th century for the USA. A falling line means below trend growth; a rising line means above trend rate economic growth per working age Australian or New Zealander.
With the election of a National Party government in 1990 and a massive fiscal consolidation, New Zealand growth rate returned to the previous trend rate of 1.9% in 1992. Ruth Richardson’s horror budget of 1991 was so bad that the what became the Twitter Left called it the “Mother of All Budgets“.
What followed this massive fiscal consolidation where welfare benefits for cut severely was an economic boom that lasted until the GFC.
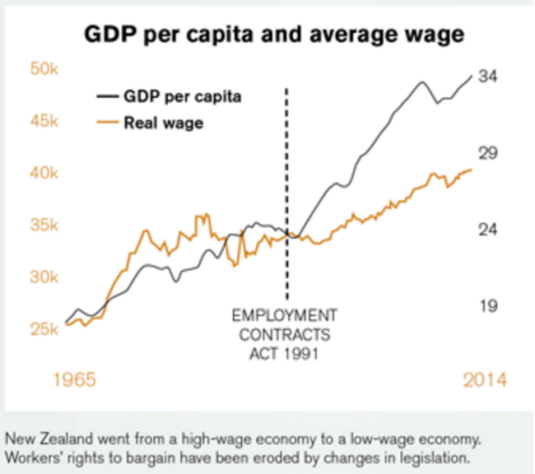
Source: Income Gap | New Zealand Council of Trade Unions – Te Kauae Kaimahi.
As shown in the chart conveniently compiled by the New Zealand Council of Trade Union, there was 20 years of real wage stagnation until the passage of the Employment Contracts Act in 1991.
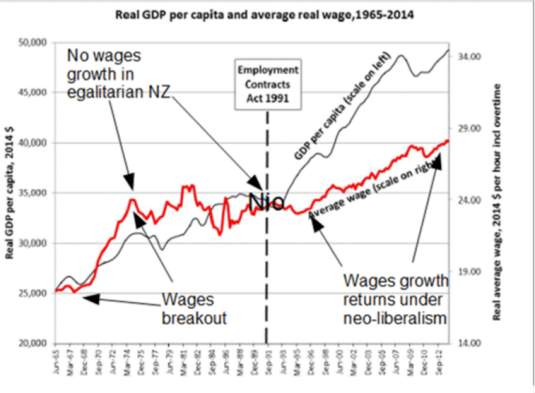
Source: Income Gap | New Zealand Council of Trade Unions – Te Kauae Kaimahi with annotations.
What followed the passage of that Act was sustained real wages growth for the first time in two decades and the end of growing inequality under the previously highly taxed, heavy regulated economy that was good old days New Zealand if the Twitter Left is to be believed.
To do this, to paint pre-1984 New Zealand, pre-neoliberal New Zealand as a fairly egalitarian paradise, Max Rashbrooke is an example of that is had to ignore two thirds of the population and the inequalities they suffered:
“New Zealand up until the 1980s was fairly egalitarian, apart from Maori and women, our increasing income gap started in the late 1980s and early 1990s,” says Rashbrooke. “These young club members are the first generation to grow up in a New Zealand really starkly divided by income.”
Racism and patriarchy can sit comfortably with a fairly egalitarian society if you are to believe the vision of the Twitter Left as to their good old days. John Quiggin refers to the period in Australia known as the Menzies Era as part of his golden age of the mixed economy. The Menzies Era was most of the 23 years of uninterrupted conservative party rule between 1949 and 1972. The actual Menzies Era was the period up to 1966 when Liberal Party Prime Minister Sir Robert Menzies retired
The reforms of the 1980s known as Rogernomics stopped the long-term stagnation in real wages that started in about 1974. The reforms of the early 1990s under a National Party government including a massive fiscal consolidation and the passing of the Employment Contracts Act was followed by the resumption of sustained growth in real wages with little interruption since.
New work by Chris Ball and John Creedy shows substantial *declines* in NZ inequality.
initiativeblog.com/2015/06/24/ine… http://t.co/f94fw4Bhae—
Eric Crampton (@EricCrampton) June 24, 2015
This boom after two decades of minimal real economic growth per working age New Zealander benefited everyone. The unemployment rate fell to a record low of 3.5% about 2005. Maori unemployment was at a 20-year low of 8% in 2008. Maori labour force participation rates increased from 45% in the late 1980s to about 62% by the eve of the Global Financial Crisis.
The increase in percentage terms of Maori and Pasifika real household income is much larger than for Pakeha since the economic reforms of the 1980s and 1990s. As Bryan Perry (2015, p. 67) explains when commenting on table D6 sourced by Closer Together Whakatata Mai:
From a longer-term perspective, all groups showed a strong rise from the low point in the mid 1990s through to 2010. In real terms, overall median household income rose 47% from 1994 to 2010: for Maori, the rise was even stronger at 68%, and for Pacific, 77%. These findings for longer- term trends are robust, even though some year on year changes may be less certain. For 2004 to 2010, the respective growth figures were 21%, 31% and 14%.
13 Nov 2015 Leave a comment
in economics of love and marriage, labour supply, politics - Australia, politics - New Zealand, politics - USA Tags: Australia, British economy, France, Ireland, Italy, maternal labour supply, single parents, sole parents, welfare state
Despite supposedly having stingy welfare states, both New Zealand and Australia have a lot of sole parents who do not work at all. There is no separate breakdown of full-time and part-time work status in the USA. About 72% of sole parents in the USA either work full-time or part-time.
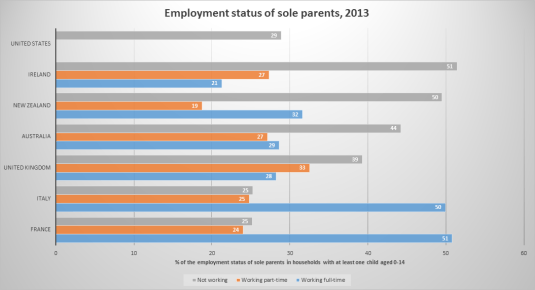
Source: OECD Family Database.
27 Oct 2015 Leave a comment
in politics - New Zealand, Public Choice Tags: Australia, expressive voting, opinion polls, rational ignorance, rational irrationality, voter demographics
https://twitter.com/Mark_Graph/status/658769666748346368/photo/1
All the bookies I follow now giving the Coalition >80% #auspol bit.ly/1GwJgc4 https://t.co/2y3iPBnnnn—
Mark the Graph (@Mark_Graph) October 23, 2015
27 Oct 2015 Leave a comment
in discrimination, economic history, gender, human capital, labour economics, occupational choice, politics - Australia Tags: Australia, gender wage gap
25 Oct 2015 Leave a comment
in discrimination, economics of education, gender, human capital, labour economics, occupational choice, politics - Australia, politics - USA Tags: Australia, British economy, Canada, reversing gender gap
There are marked differences in progress in tertiary educational attainment between countries and across the generations. For example, while a few more American women have tertiary degrees as compared to their mothers, there’s been no change for American men for a generation.

Source: Indicators of Gender Equality in Education – OECD.
Canada is firing ahead in both tertiary educational attainment and reversing the gender gap in education for good. Two thirds of prime age Canadian women have a tertiary degree as compared to half of their mothers.
The number of British women with tertiary degrees is also much higher than their mothers. British men are trying their best to keep up.
25 Oct 2015 Leave a comment
in economic history, economics of media and culture Tags: Australia, creative destruction
#OTD 21 Oct 1872 a UK – Australia telegraph service opened from London to Darwin, 20 hours to transmit a message! https://t.co/cgnbhLzAuw—
BT Archives (@BTArchives) October 21, 2015
Celebrating humanity's flourishing through the spread of capitalism and the rule of law
Scholarly commentary on law, economics, and more
Beatrice Cherrier's blog
Celebrating humanity's flourishing through the spread of capitalism and the rule of law
Celebrating humanity's flourishing through the spread of capitalism and the rule of law
Celebrating humanity's flourishing through the spread of capitalism and the rule of law
Why Evolution is True is a blog written by Jerry Coyne, centered on evolution and biology but also dealing with diverse topics like politics, culture, and cats.
Celebrating humanity's flourishing through the spread of capitalism and the rule of law
Celebrating humanity's flourishing through the spread of capitalism and the rule of law
A rural perspective with a blue tint by Ele Ludemann
DPF's Kiwiblog - Fomenting Happy Mischief since 2003
Celebrating humanity's flourishing through the spread of capitalism and the rule of law
The world's most viewed site on global warming and climate change
Tim Harding's writings on rationality, informal logic and skepticism
A window into Doc Freiberger's library
Let's examine hard decisions!
Commentary on monetary policy in the spirit of R. G. Hawtrey
Thoughts on public policy and the media
Celebrating humanity's flourishing through the spread of capitalism and the rule of law
Politics and the economy
A blog (primarily) on Canadian and Commonwealth political history and institutions
Reading between the lines, and underneath the hype.
Economics, and such stuff as dreams are made on
"The British constitution has always been puzzling, and always will be." --Queen Elizabeth II
Celebrating humanity's flourishing through the spread of capitalism and the rule of law
Celebrating humanity's flourishing through the spread of capitalism and the rule of law
WORLD WAR II, MUSIC, HISTORY, HOLOCAUST
Undisciplined scholar, recovering academic
Celebrating humanity's flourishing through the spread of capitalism and the rule of law
Res ipsa loquitur - The thing itself speaks
Celebrating humanity's flourishing through the spread of capitalism and the rule of law
Researching the House of Commons, 1832-1868
Articles and research from the History of Parliament Trust
Reflections on books and art
Posts on the History of Law, Crime, and Justice
Celebrating humanity's flourishing through the spread of capitalism and the rule of law
Exploring the Monarchs of Europe
Cutting edge science you can dice with
Small Steps Toward A Much Better World
“We do not believe any group of men adequate enough or wise enough to operate without scrutiny or without criticism. We know that the only way to avoid error is to detect it, that the only way to detect it is to be free to inquire. We know that in secrecy error undetected will flourish and subvert”. - J Robert Oppenheimer.
The truth about the great wind power fraud - we're not here to debate the wind industry, we're here to destroy it.
Celebrating humanity's flourishing through the spread of capitalism and the rule of law
Celebrating humanity's flourishing through the spread of capitalism and the rule of law
Economics, public policy, monetary policy, financial regulation, with a New Zealand perspective
Celebrating humanity's flourishing through the spread of capitalism and the rule of law
Restraining Government in America and Around the World


Recent Comments