
Do the Rich Pay Their Fair Share?
13 Jul 2016 Leave a comment
in politics - USA, public economics Tags: envy, superstars, taxation and entrepreneurship, taxation and investment, top 1%, top 10%
% of top incomes from wages, salaries and pensions
23 May 2016 Leave a comment
in applied price theory, applied welfare economics, economic history, entrepreneurship, human capital, industrial organisation, labour economics, labour supply, occupational choice, poverty and inequality, survivor principle Tags: entrepreneurial alertness, envy, superstar wages, superstars, top 1%, top incomes
Everybody from the top 10% to the top 0.01% have to work for their living these days with much of their income coming from wages.

Source: The World Wealth and Income Database.
@MaxCRoser the impact of the top 1% on Swedish economic growth
25 Oct 2015 Leave a comment
in applied welfare economics, economic growth, economic history, macroeconomics, Marxist economics Tags: endogenous growth theory, envy, Leftover Left, politics of envy, Sweden, top 1%
#Sweden: Inequality decreased hugely in the 20th century – but is now rising.
bit.ly/1DEBY1P https://t.co/MHPgp29AWZ—
Max Roser (@MaxCRoser) October 24, 2015
A fall in the share of the top 1% of total Swedish total incomes was in tune with the emergence of a new word in the English language which was Swedosclerosis. That was the long stagnation in the Swedish economy in the 1970s and the 1980s with Swedish economic growth well below that in the trend rate of growth in the USA. Only after an increase in the top 1% share in Sweden did economic growth start recovering to trend.
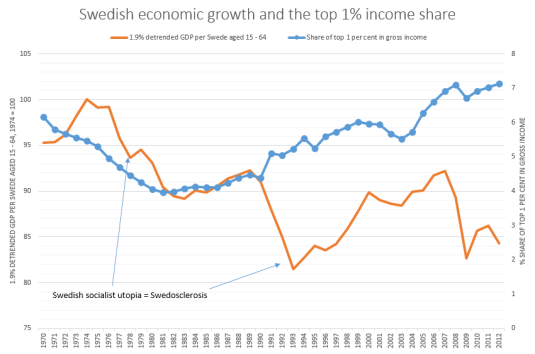
Source: Computed from OECD StatExtract and The Conference Board. 2015. The Conference Board Total Economy Database™, May 2015, http://www.conference-board.org/data/economydatabase/
In the chart above, a flat-line in real GDP per working age Swede is growth at the trend rate of the US economy for the 20th century which was 1.9% per year. A falling line is Swedish growth below trend, a rising line is growth above that trend rate of 1.9% in Sweden. A trend rate of 1.9% is the trend rate of growth currently used by Edward Prescott for the USA in the 20th century.
How is the top 10% doing?
01 Sep 2015 Leave a comment
in applied welfare economics, human capital, labour economics, poverty and inequality Tags: envy, top 1%
The taxes paid by the rich, middle-class and the poorer in the USA
09 Aug 2015 Leave a comment
in politics - USA, public economics Tags: creative destruction, entrepreneurial alertness, envy, taxation and entrepreneurship, taxation and investment, taxation and the labour supply, top 1%
Average Income Before & After Federal Taxes from "An Illustrated Guide to Income" bit.ly/1j9ymXF #inequality http://t.co/eabwDATSlU—
Catherine Mulbrandon (@VisualEcon) April 28, 2014
The tax rates of the top 1%
04 Aug 2015 Leave a comment
in applied welfare economics, entrepreneurship, fisheries economics, income redistribution, politics - USA, rentseeking Tags: entrepreneurial alertness, envy, taxation and entrepreneurship, taxation and investment, taxation and the labour supply, top 1%
Historical Tax Rates of Top 0.01% (15,000 returns reporting more than $8 million in 2010) visualizingeconomics.com/blog/2013/8/14… http://t.co/XygW0t0npu—
Catherine Mulbrandon (@VisualEcon) August 15, 2013
The top 400 income tax returns in the USA
20 Jul 2015 Leave a comment
The top 0.000003% in the US
by @VisualEcon http://t.co/eHmUrWzp6X—
Max Roser (@MaxCRoser) July 16, 2015


Helmut Schoeck on what a miserable sin is envy
23 Aug 2014 Leave a comment
in liberalism Tags: distributive justice, envy, Helmut Schoeck, social justice

HT: Cafe Hayek

Stephen Williamson on Marginal Taxation
03 Aug 2014 Leave a comment
in applied welfare economics, fiscal policy, income redistribution, politics - New Zealand, politics - USA, Public Choice Tags: envy, Stephen Williamson, taxation and entrepreneurship, taxation and human capital, taxation and investment, taxation and labour supply, top 1%
He says a lot. I’ll try to address piece by piece.
Next, some people have shown interest in this paper by Diamond and Saez. A key result that seemed to get these people excited is the calculation of a top optimal marginal tax rate (including all taxes) of 73%, relative to the current rate of 42.5%. There are two key assumptions that Diamond and Saez make to come up with the 73% optimal rate. First, we should not care about the welfare (at the margin) of the rich people. This argument is based solely on the notion that marginal utility of income is low for the top income-earners. Second, Diamond and Saez use a “behavioral elasticity” of tax revenue with respect to the tax rate of 0.25. To see how this matters, if you use their formula and an elasticity of one, you get an optimal top tax rate…
View original post 1,215 more words


Recent Comments