.@noamscheiber picks up on a new consensus in #minimumwage research on restaurant employment. http://t.co/mEvRef4GMj pic.twitter.com/4BFaFRCy2v
— Arin Dube (@arindube) July 27, 2015
.@noamscheiber picks up on a new consensus in #minimumwage research on restaurant employment. http://t.co/mEvRef4GMj pic.twitter.com/4BFaFRCy2v
— Arin Dube (@arindube) July 27, 2015
@arindube much safer to just increase the earned income tax credit. no jobs would be put at risk.http://t.co/LParULo9DM
— Jim Rose (@JimRosenz) September 11, 2015
#MinimumWage physics analogy fail "Just as no physicist would claim that 'water runs uphill'" https://t.co/V7WZuyy9U0 pic.twitter.com/xC0ipC2B1a
— Arin Dube (@arindube) August 21, 2015
@arindube Paul Krugman on the minimum/living wage in 1998
11 Sep 2015 Leave a comment
in labour economics, minimum wage, poverty and inequality Tags: family tax credits, living wage, minimum wage, social insurance

The great divergence in average and marginal tax rates in New Zealand since 2000
20 Aug 2015 1 Comment
in applied price theory, applied welfare economics, human capital, labour supply, politics - New Zealand, public economics Tags: family tax credits, lost decades, taxation and the labour supply
21% would have been a good guess of the average and marginal tax rates of the New Zealand single earner or couple including with children and even a second earner in 2001. New Zealand average and marginal tax rates have been on a wild ride since the year 2000.
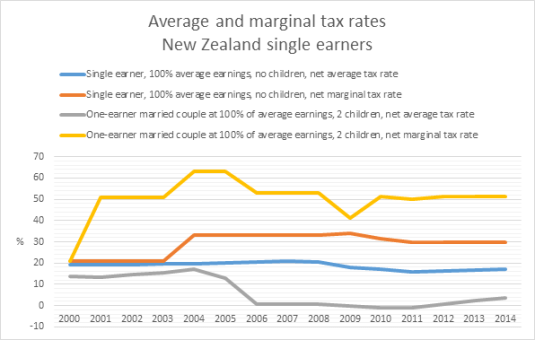
Sources: OECD StatExtract and OECD Taxing Wages.
As the above chart shows, while the average tax rate of a single earner with no children is pretty much unchanged at about 20%, he now faces a marginal tax rate of 30% or more rather than 21% in 2001.
For a married couple with one income, as the above chart shows, their average tax rate has been about zero for a good 10 years now but their net marginal tax rate is a good 50% or more because of abatement rates on family tax credits, which is a skewed incentive situation. A large income effect from the family tax credit encourages the consumption of leisure but a high marginal tax rate discourages working more.
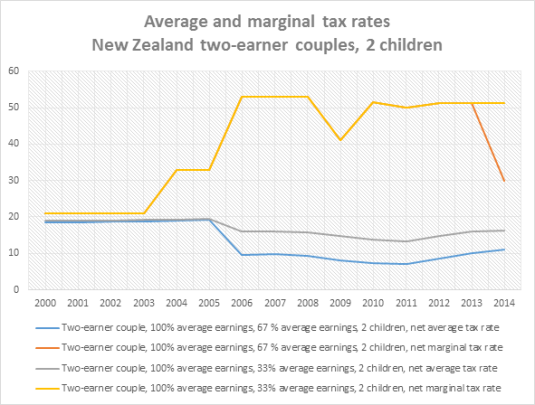
Sources: OECD StatExtract and OECD Taxing Wages.
For two earner couples, their average tax rates have fallen because of family tax credits but their marginal tax rates have gone through the roof as the above chart shows. A tax system that discourages quite severely any further work or investment in human capital by average earners may have adverse effects on the long-term trend growth rate of New Zealand.
Director’s Law in New Zealand?
14 Aug 2015 Leave a comment
in applied price theory, income redistribution, labour economics, politics - New Zealand, poverty and inequality, Public Choice, public economics Tags: child poverty, Director's Law, family poverty, family tax credits, welfare state
One group with negative net tax liability is low- to middle-income households with dependent children. For example, single-earner families with two children can earn up to around $60,000 pa before they pay any net tax.
Around half of all households with children receive more in welfare benefits and tax credits than they pay in income tax.
![clip_image002[6]](https://utopiayouarestandinginit.com/wp-content/uploads/2015/08/clip_image0026.jpg "clip_image002[6]")
@metiria @NZGreens 20,000 drop in children in hardship in 2014
13 Aug 2015 Leave a comment
in applied welfare economics, economic history, income redistribution, labour economics, politics - New Zealand, poverty and inequality, Public Choice, welfare reform Tags: child poverty, family poverty, family tax credits, Leftover Left, New Zealand Greens, Twitter left
The material hardship measure shows a falling child material hardship rate using a threshold equivalent to the ‘standard’ EU level, down from a peak of 21% immediately after the GFC to 14% in 2014.
Using the more severe threshold, there was a slight rise through the GFC to 10% and a small fall to 8%, the level it was at before the GFC.

Source: Bryan Perry, Household Incomes in New Zealand: trends in indicators of inequality and hardship 1982 to 2014 – Ministry of Social Development, Wellington (August 2015), p. 133.

Source: Bryan Perry, Household Incomes in New Zealand: trends in indicators of inequality and hardship 1982 to 2014 – Ministry of Social Development, Wellington (August 2015), p. 133.
Taxes on minimum wage earners across the OECD area
28 Jul 2015 Leave a comment
in labour economics, labour supply, politics - Australia, politics - New Zealand, politics - USA, welfare reform Tags: earned income tax credits, family tax credits, in-work tax credits, taxation and the labour supply
#MinimumWage shd be combined w/ #tax policies to help both workers & their employers; see bit.ly/1KfRNOB http://t.co/8klfJXmY4s—
(@OECD) July 25, 2015
If government “programmes have been doing very little to help children out of poverty”, what halved child poverty in the last 20 years? Economic growth?
16 Jul 2015 Leave a comment
in economic growth, labour economics, labour supply, minimum wage, politics - New Zealand, poverty and inequality, unemployment, welfare reform Tags: child poverty, family poverty, family tax credits, in-work tax credits, social insurance, welfare reform, welfare state

RNZ: Govt advised in 2013 "social mobility" approach won't materially address child poverty. rnz.to/1RwVWoj http://t.co/nfd2gY0qcH—
Alastair Thompson (@althecat) July 14, 2015
Figure 1: child poverty (%) in New Zealand (before and after housing costs), 1982 – 2013

Source: Bryan Perry, Household incomes in New Zealand: Trends in indicators of inequality and hardship 1982 to 2013. Ministry of Social Development (July 2014), Tables F.6 and F.7.
Has NZ child poverty doubled as @MaxRashbrooke said?
09 Jul 2015 1 Comment
in applied welfare economics, economic history, economics of regulation, labour economics, law and economics, politics - New Zealand, poverty and inequality, property rights Tags: Auckland urban limit, child poverty, Director's Law, expressive voting, family poverty, family tax credits, in-work tax credits, land use planning, median voter theorm, rational ignorance, rational irrationality, RMA, top 1%, working for families
Lindsay Mitchell put me onto a quote by veteran grumbler Max Rashbrooke that the child poverty rate doubled in New Zealand:
In a system where income goes disproportionately to the already well-off, ordinary workers are missing out on the rewards of their efforts, to the tune of billions of dollars a year. Welfare benefits, cut by a quarter in 1991 and increased just 8 per cent in the last budget, are far too low to meet people’s basic needs.
The result is a doubling of child poverty and the return of childhood diseases unknown in most developed countries – a national embarrassment, as one researcher described it.
Poverty, income and inequality data is collected in loving detail by Brian Perry every year for the Ministry of Social Development.
Figure 1: % child poverty in New Zealand (before and after housing costs), 60% 1998 median constant value, 1982 – 2013

Source: Bryan Perry, Household incomes in New Zealand: Trends in indicators of inequality and hardship 1982 to 2013. Ministry of Social Development (July 2014), Tables F.6 and F.7.
The only thing noticeable in the downward trend in child poverty in New Zealand since its doubling with the sharp recession in 1990 with double-digit unemployment rates is child poverty stop falling shortly after in-work family tax credits were introduced in the form of Working for Families in 2005.
New QV figures show Auckland house prices are up a massive 16.1% on last year, now estimated to reach $1m by Aug '16. http://t.co/DwAU79ozCy—
New Zealand Labour (@nzlabour) June 09, 2015
There was a break in trend in the long decline in child poverty as soon as in-work family tax credits were introduced in New Zealand. I’m sure this is a coincidence because, as Brian Perry said when discussing the introduction of Working for Families in 2005:
The 2004 to 2007 period was the only one in the 25 years to 2007 in which the incomes of low- to middle-income households grew more quickly than those of households above the median.
The real killer in New Zealand in terms of poverty and inequality are housing costs. Housing costs are wholly under the control of government through its control of the supply of land, which is restricted at the behest of the parties of the left.
Figure 2: real equivalised household incomes (before and after housing costs): changes at the top of lowest income decile, New Zealand, 1982 to 2013

Source: Bryan Perry, Household incomes in New Zealand: Trends in indicators of inequality and hardship 1982 to 2013. Ministry of Social Development (July 2014), tables D.2 and D.4.
Figure 2 shows that real equivalised household income after housing costs has not grown and in fact has fallen for the bottom 10% of the income distribution in New Zealand.

It is the left-wing parties who oppose measures to reduce housing costs and and increase the supply of land through reforms to the Resource Management Act and the relaxation of the Auckland metropolitan urban limit.

Labour and the Greens are in effect keeping the poor poor to win middle-class votes.
Figure 3: real equivalised household incomes (before and after housing costs): changes at the top of the top, middle and lowest lowest income deciles, New Zealand, 1982 to 2013

Source: Bryan Perry, Household incomes in New Zealand: Trends in indicators of inequality and hardship 1982 to 2013. Ministry of Social Development (July 2014), tables D.2 in D.4.
Figure 3 shows that those in the middle and higher deciles, a political territory rich in swinging voters, are still doing well after housing costs. The parties of the left are collaborating with a middle-class home owning voter while betraying the working class and its aspirations from home ownership and quite simply affordable housing costs when they rent.
The increases for all groups may be understated by the inability of living standards measures to adequately account for new goods, product upgrades and rising life expectancies.
All in less cash transfers average income tax rates at average wage, USA, UK, Australia and New Zealand
27 Jun 2015 Leave a comment
in labour supply, politics - Australia, politics - New Zealand, politics - USA, poverty and inequality, public economics Tags: Australia, British economy, family tax credits, family taxation, in-work tax credits, social insurance, taxation and the labour supply, welfare state
Figure 1: All in less cash transfers average income tax rates at average wage, 2014

Source: OECD tax database
Many American families face negative affected income taxes rates
23 Jun 2015 Leave a comment
in economics of love and marriage, labour economics, politics - USA, public economics Tags: earned income tax credit, economics of families, family tax credits
US income taxes are highly progressive
19 Jun 2015 Leave a comment
in politics - USA, public economics Tags: earned income tax credit, family tax credits, progressive income taxes, tax incidence, top 1%, welfare state
The futility of minimum wage increases as a poverty reduction strategy
31 May 2015 Leave a comment
in labour economics, labour supply, politics - USA, welfare reform Tags: family tax credits, poverty traps, welfare reform, welfare state

Recent Comments