


Key facts about the gender pay gap–Pew Centre research
10 Jan 2015 Leave a comment
in discrimination, gender, human capital, labour economics, occupational choice Tags: gender wage gap, labour economics, sex discrimination
How big is the sexism problem in economics? This article’s co-author is anonymous because of it
07 Jan 2015 Leave a comment
in discrimination, gender, human capital, labour economics, occupational choice, politics - USA Tags: gender wage gap, reversing gender dao
Why is it assumed that economics is the best available choice for women with mathematical skill?
Just as many men as women qualify for engineering and science but more of these same women also qualify for law and medicine.
Why enroll in engineering, science or economics if you have qualified for law or medicine?
The Gender-Pay Gap Is Largest for the Highest-Paying Jobs – The Atlantic
18 Dec 2014 Leave a comment
in discrimination, gender, human capital, labour economics, labour supply, occupational regulation Tags: employer discrimi, gender wage gap, sex discrimination

How New Zealand’s rich-poor divide killed its egalitarian paradise | Max Rashbrooke | The Guardian – a boy’s own fact check
13 Dec 2014 Leave a comment
in discrimination, gender, labour economics, poverty and inequality Tags: gender wage gap, Gini coefficient, poverty and inequality, top 1%
What is claimed to have gone wrong by the op-ed in The Guardian overnight?
A stark rich-poor divide, the OECD argued, had taken over a third off the country’s economic growth rate in the last 20 years. But how could this be?
The simple answer is that in the two decades from 1985 onwards, New Zealand had the biggest increase in income gaps of any developed country.
Incomes for the richest Kiwis doubled, while those of the poorest stagnated. Middle income earners didn’t do too well, either.
Are these claims true? That is, in the two decades from 1985 onwards, have the incomes of the richest Kiwis doubled, while those of the poorest stagnated and have a middle income earners not done too well either?
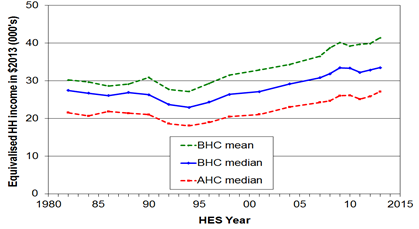
Figure 1 shows that prior to the recent recession starting in 2009, there were 15 years of steady growth in median household incomes. As will be shown, most of the period covered both by the op-ed in the Guardian, and by the OECD paper was an economic boom.
Figure 1: Real household income trends before housing costs (BHC) and after housing costs (AHC), 1982 to 2013 ($2013)
Source: Bryan Perry, Household incomes in New Zealand: Trends in indicators of inequality and hardship 1982 to 2013. Ministry of Social Development (July 2014).
Perry (2104) found that net income gains from the mid-1990s to 2013 were similar for all income groups, so income inequality in 2013 was also similar to the mid-1990s – see Figure 2.
Figure 2: Real household incomes (BHC), changes for top of income deciles, 1994 to 2013
![clip_image002[7]](https://utopiayouarestandinginit.com/wp-content/uploads/2014/12/clip_image0027.png "clip_image002[7]")
Source: (Perry 2014).
Importantly, in the OECD analysis, much was made of what was happening to the 40% income decile. As can be seen from figure 2, this decile gained as much as any other group in New Zealand from the income growth between 1994 and 2013.
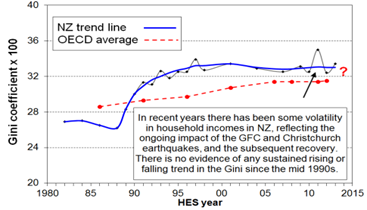
The Gini coefficient in figure 3 , which years the most common measure of inequality, shows no evidence of a rise in income inequality since the mid-1990s. The trend-line of the genie coefficient in figure 3 is almost flat since the early 1990s .
Figure 3: Gini coefficient New Zealand 1980-2015
Source: (Perry 2014).
To make things more awkward, the large increase in income inequality in New Zealand in the late 1980s and early 1990s shown in figure 3 was followed by a 15 year economic boom after 20 years of economic stagnation – next to no income growth – as is shown in figure 4.
Figure 4: Real GDP per New Zealander and Australian aged 15-64, converted to 2013 price level with updated 2005 EKS purchasing power parities, 1956-2013

Source: Computed from OECD Stat Extract and The Conference Board, Total Database, January 2014, http://www.conference-board.org/economics
The lost decades of the growth in the 1970s and 1980s were replaced with a long boom. Trend growth of 2% per year returned after this increase in inequality – see figure 4.
The gains since the economic boom since the early 1990s has been broadly based both up and down the income distribution and by ethnicity. As shown in figure 5, between 1994 and 2010, real equivalised median household income rose 47% from 1994 to 2010; for Māori, this rise was 68%; for Pasifika, the rise was 77%.
Figure 5: Real equivalised median household income (before housing costs) by ethnicity, 1988 to 2013 ($2013).
![clip_image002[9]](https://utopiayouarestandinginit.com/wp-content/uploads/2014/12/clip_image00292.png "clip_image002[9]")
Source: (Perry 2014).
These improvements in Māori incomes since 1992 were based on rising Māori employment rates, fewer Māori on benefits, more Māori moving into higher paying jobs, and greater Māori educational attainment should be celebrated and consolidated. Māori unemployment reached a 20-year low of 8 per cent from 2005 to 2008.
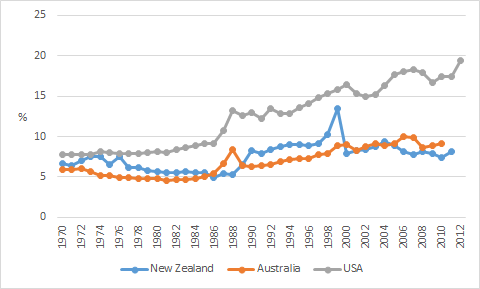
As for the top 1%, as shown by Figure 6, their income share has been steady at 8-9% since the mid-1990s. It was only in the USA the top 1% share continued to rise strongly, from 13% to 19%.
Figure 6: income shares of the top 1% of earners, New Zealand, Australia and USA
source: Top incomes database
Over the last more than two decades in New Zealand, there has been sustained income growth spread across all of society. Perry (2014) concluded that:
Overall, there is no evidence of any sustained rise or fall in inequality in the last two decades.
The level of household disposable income inequality in New Zealand is a little above the OECD median.
The share of total income received by the top 1% of individuals is at the low end of the OECD rankings.
What is claimed as the causes of this growing rich-poor divide that is also slowing growth by a third?
Tracing the causes of a growing income gap is like trying to map earthquake fault lines – never a precise science – but it is hard to ignore the correlation between the timing of the increase and the country’s post-1984 political revolution.
Embracing reforms known elsewhere as Thatchernomics and Reaganomics with unprecedented enthusiasm, New Zealand halved its top tax rate, cut benefits by up to a quarter of their value, and dramatically reduced the bargaining power – and therefore the share of national income – of ordinary workers.
Thousands of people lost their jobs as manufacturing work went overseas, and there was no significant response with increased trade training or skills programmes, a policy failure that is on-going.
At the same time, New Zealand stopped building affordable houses in any serious quantity, forcing poorer households to spend ever-increasing amounts on rent and mortgages.
As will be recalled from Figure 4, the economic reforms in New Zealand were followed by a long economic boom starting in 1992 that only came to an end with the onset of the global financial crisis.
Figure 7 shows that from 1994, the proportion of the lowest income households spending more than 30% of their income on housing fell steadily, reaching 34% by 204.
Figure 7: Proportion of households spending more than 30% of their income on housing costs by income quintile, New Zealand 1988–2013 HES years

Source: Perry (2014)
Housing affordability was improving for much of the period in which the op-ed in the Guardian was claiming it was getting worse. The increase in housing unaffordability in the late 1980s and early 1990s coincided with a deep recession and a cut in welfare benefits.
Housing affordability has become an issue in New Zealand because of rising prices. Supply is not keeping up with demand.
There were considerable increases in prices throughout the house price distribution between 2004 and 2008. Median house price increasing by over 50% between 2004 and 2008; the price rises were largest among the lower price houses.
It was not a case of a decline in demand under the hypothesis that is put forward in the op-ed in the Guardian. For that hypothesis to hold, housing prices would somehow have to fall in the price range of ordinary workers. That is not the case.
Furthermore, the large increase in housing prices and decline in housing affordability occurred a decade and more after the increase in inequality in the late 1980s and early 1990s. The timing is out.
Another inconvenience for the rich poor divide hypothesis is during the housing price boom after 2004 rent to disposable income for all income quintiles remained relatively constant. Rents were stable.
Poorer households are more likely to rent, and therefore much less likely to be affected by the housing affordability crisis in New Zealand as that was mostly about home ownership.
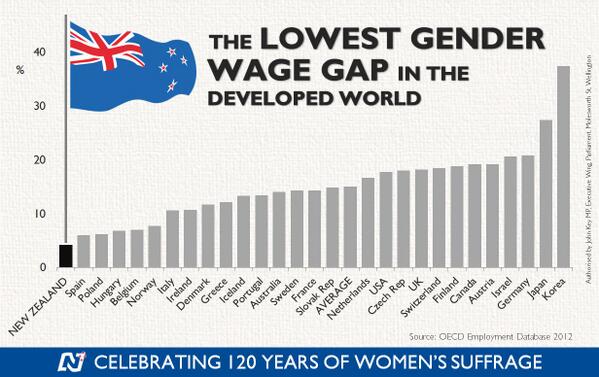
Gender analysis! Gender analysis? Where is the gender analysis? Over the last 20 to 30 years, the gender gap has closed substantially in terms of wages and employment. Young women now outnumber young men two to one at university.

New Zealand has the smallest gender wage gap in the Western world. That is inconsistent with the notion in New Zealand has a rich poor divide. Instead New Zealand appears to be an egalitarian paradise as long as you are not a boy!
The major driver of inequality in New Zealand and overseas is the rising number of two-income households made up of two well-educated parents and one or two children and many more single parent households on low pay or no one in paid employment in the house. Well-educated couples form into high income households; fewer of the less educated marry and too many end up a single mothers.

Source: closertogether.org.nz
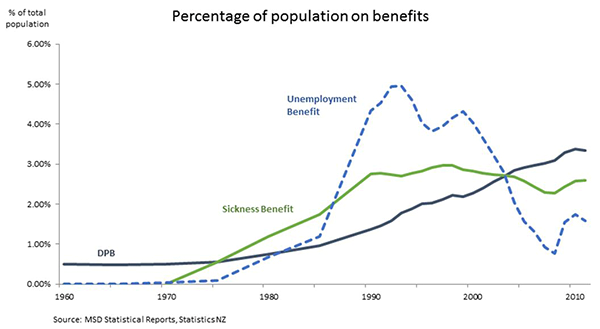
The main cause of poverty in New Zealand is dependency on welfare benefits and in particular the number of single parents. Child poverty in beneficiary families is 75% to 80%, much higher than in families with at least one adult in full-time employment (11% in 2012 and 2013). The payment of welfare benefits to families who do not work guarantees an income to people not in a job, but it creates incentives not to work.
The economic and sociological literatures overseas increasingly suggesting that skill disparities resulting from a lower quality education and less access to good parenting, peer and neighbourhood environments produce most of the income gaps of racial and ethnic minorities rather than factors such as labour market discrimination.
Some economics of the marriage bars (and mandatory retirement ages)
11 Dec 2014 1 Comment
in discrimination, gender, labour economics, personnel economics Tags: employer discrimination, gender wage gap, lump of labour fallacy, marriage bar, seniority pay, sex discrimination
Up until 1966, women had to quit from the Australian Public Service when they married! The bar was repealed in 1966 with a private members bill by Bill Hayden.
Some hid their marriages for years, hiding their rings before they got to work.
One woman remained unmarried and bore four children. She managed this by timing her annual leave to cover the births.
While her personnel area was co-operative, they forced her to resign her middle management position when she decided to make an honest man of her de facto husband by marrying the father of their children.
Claudia Goldin found that marriage bars were policies adopted by firms and local school boards, from about the early 1900’s to 1950. They fired single women when they married and would not not to hire married women.
The marriage bar, which had at its height affected 751 of all local school boards in the USA and more than 50% of all office workers, was virtually abandoned in the 1950’s when the cost of limiting labour supply greatly increased.
When marriage bars disappeared, Goldin found that older female workers in the mid-1950’s were suddenly praised for their “maturity, reliability, neat appearance, and less chatty nature”.
In retail trades, and especially in suburban retail shops, Goldin found that older married women with absolutely no previous training were now the “ideal employee”; the middle-class woman were “naturally courteous” and “well-bred,” and who did not have to work became the preferred recruits of the major department stores. the best female employee was, in the words of a Sears, Roebuck, and Co. officer
a married woman with a mortgage on her house and her children partially raised
These sudden changes in the attitude of employers towards the recruitment of women of different ages and marital status suggests that the previous personnel policies were disciplined by competition.
Marriage bars, in the private sector, were instituted by large firms with centralised hiring promotion and salary schedules that were often fixed and based on tenure with the firm, and other modern employment practices.
This evidence suggested to Claudia Goldin that firms may have wanted to encourage turnover when earnings rose more rapidly with tenure than productivity. These employers in firms with rigid wage systems, tied to their workers’ seniority, desired a young, inexperienced work force. Goldin hypothesise that the marriage bar was a socially acceptable way of terminating the employment of young women whose wages would eventually rise to exceed their addition revenue to the firm.
Goldin suggested that the marriage bar had some relationship to seniority pay, as discussed by Edward Lazear.
Under seniority pay, and employees paid less than their productivity in their early years of employment but more in their later years of employment up to say a retirement date.

By back loading salary, the employer could economise on the cost of monitoring the employee’s performance and especially so in jobs where it was hard to evaluate performance. Because of the prize at the end of the road: a large salary paid towards the end of a career, an employee had more reasons to be honest and not to underperform and risk dismissal.
Not all workers may be compensated under long-term seniority pay contracts. Routine office workers, support staff, sales agents, and so on appear to be compensated on a spot basis rather than under long-term incentive contracts.
Workers in these more routine occupations have lower monitoring costs. Their productivity can be more easily and cheaply measure directly.
There is no need for sophisticated incentive contracts as is the case more often with managerial Employees and workers who hold positions of trust. In both cases , the back loading a salary operates as a bond against poor performance and dishonesty.

Most women entered the workforce by the age of 18 in the mid to early 20th century. They married in their early to mid-20s. This meant that the maximum length of their career with the firm would be 5 to 7, maybe 10 years.
Because these women are often assigned to low skilled clerical duties where there are a few promotion prospects, the productivity of these women did not increase much with time in the job.
To make sure that some women didn’t stay on to receive the seniority based salary increases by not marrying, Goldin found that some firms offered a substantial dowry is to women when they married if that already been with the firm for six years.
These dowries were buying women out of jobs where their wages were rising, but their productivity was stable.
Another advantage of buying women out of their jobs when they married was that the male co-workers didn’t have to be paid a wage premium for less job security can as they themselves could be dismissed on similar grounds.
Marriage bars were found by Goldin to be associated with fixed salary scales, internal promotion, and other personnel practices and they are not associated with piece-rate work.
Subsequent work on mandatory retirement ages in the public private sector found a similar link to both seniority pay and organisational architecture and the the limits of individual managerial discretion over firing.
The organisational architecture of a firm encompasses the assignment of decision rights within the firm, the methods of rewarding individual employees, and the structure of the systems that evaluate the performance of individual employees and business units.
Some larger firms may struggle to administer internal corporate governance structures which permit more local managerial discretion over employment relationship matters and still properly control the costs of a more diverse workforce.
A price of growth in the size of a firm is often the standardisation of products, workforce compositions and terms of employment.
When mandatory retirement was lawful, large firms with centralised personnel structures are more often to be found to have mandatory retirement ages.
The nub of the problem is large firms have several layers of management with fairly strict limits on what each individual line manager can do (Williamson 1975, 1985; Fama and Jensen 1983b).
There must be limits on local managerial discretion because the owners and senior managers set the strategic direction of the firm, the products it sells, and how many workers are employed and on what wages.
Larger firms may struggle with striking the most profitable balance between greater local managerial discretion and effective corporate governance of a large diverse organisation with professional managers and diffuse ownership structures. It will be shown that very large firms promulgate rigid personnel policies while smaller firms are much more flexible in their deals with individual employees.
This balance between local managerial discretion and central control must extend to wages and hours because labour costs make up much of the costs of many firms. Changes in policies on wages and conditions are subject to ratification and monitoring by head office and the corporate board in managerial firms.
This increasing rigid separation of decision management rights from decision control rights as a managerial firm grows will restrict flexibility in terms of employment, including phased retirements. Top level managers and board members both have limited amount of time to allocate, limited spans of control, and will have less and less detailed knowledge of their firm as it grows.
Limits on the degree of local managerial discretion over employment relations in large managerial firms can arise from restrictions on managerial delegations, divided decision making rights, hierarchical approval procedures, and the breath and content of wage and personnel policies. This can include not having a personnel policy on the availability of phased retirements. This gap can be through choice, inertia or attention to other concerns currently of a higher priority.
The discretion of supervisors in large firms over the terms and conditions of employment of individual members of their team may be limited to individual performance ratings (Gibbs and Hendricks 2004).
Smaller firms have more more discretion over retirement ages was is less of a separation of ownership and control, and owners are much more able to be on-site and of balance risks and rewards from innovations.
Good evidence to illustrate the proposition that larger firms prefer rigid rules over discretion in personnel policies comes from the days of mandatory retirement. Mandatory retirements can be viewed as the wholesale substitution of local managerial discretion with a single company-wide rule because larger firms find idiosyncratic decisions to be more costly (Parsons 1997).
Back when they were legal, mandatory retirements are near universal in very large workplaces, but in small to medium size firms, there were flexible retirement polices. Few very large firms reported flexible retirement polices. The smaller firms provided for policies that allowed for exceptions to mandatory retirement rules while most of largest firm reported a policy of zero exceptions to mandatory retirement rules (Parsons 1997).
The line managers in small firms were more willing to allow an older worker to work passed the usual retirement age because they had more delegations with regard to terms and conditions of employment. In addition, in smaller firms, the owners are more likely to be among the management team for the CEO and able to closely supervise the success of the discretionary decisions of junior management over conditions of employment and hiring and firing.


How Some Women Benefit From Marrying a Man Who Makes Less Money – The Atlantic
09 Dec 2014 Leave a comment
in discrimination, gender, labour economics Tags: asymmetric marriage premiumClick add, gender wage gap, power couples, sex discrimination

The large and growing gap is not due to timid female MBAs.
Some of it is attributed to different skills, jobs before the MBA, and that male business students typically take more finance classes and women more marketing classes.
But a majority of the difference is due to women taking time out of the labor force and then working less after having children.
Women without children usually don’t take time off, and most of their earnings disparity with men can be explained by differences in their skills.
It’s notable that the earnings of some women did not fall very much after they had children and any drop in income did not persist after a few years.
But these women often had a “lower” earning spouse (income under $100,000). A large and sustained drop in income is highly correlated with having children and a high-earning husband.
via How Some Women Benefit From Marrying a Man Who Makes Less Money – The Atlantic.
Claudia Goldin and the power of the pill
04 Dec 2014 1 Comment
in economics of education, economics of love and marriage, gender, human capital, labour economics, labour supply Tags: Claudia Goldin, engines of liberation, gender wage gap, sex discrimination, single parenthood
Claudia Goldin has documented well that the availability of reliable contraception in the late 1960s led to an explosion in female investment in higher education, and in particular, long duration professional educations.
Although rapidly disseminated among married women once it came on the market in 1960, the pill at first was almost inaccessible to single females, due to the prevailing state laws on prescriptions of drugs.
Liberalisation of availability for single females was on a state-by-state basis and was staggered over a few years. This allowed Claudia Goldin to study what happened to investment in professional education by young women in each of those states as they reformed their laws on the dispensing of contraception to single females.

As contraception was made lawful for single women on a state-by-state basis in the USA in the late 60s and 1970s, young women started investing in long duration professional educations at an explosive rate. They stayed in high school the longer, more young women went on to college, and more of these college female students majored in long duration professional degrees.

In the 1960s, it was common to get engaged and even marry while at college in the USA. As Claudia Goldin, and her co-author Larry Katz explain:
It was a stark choice, you could be celibate, get your career started, and potentially face a very thin marriage market once you were done.
Or, you could have fun, get married earlier, and not necessarily have a career.
The availability of the pill allowed college-age women to have certainty in their career investments and therefore the payoff of investing in professional educations was much greater.

By decoupling sex for marriage, women could afford to defer marriage and shop around looking for better partners. Postponing marriage for at least a few years didn’t mean all the “good guys” would be taken. In addition, with higher career incomes for female college graduates, as Goldin explained:
You might think of it as the decline of the trophy wife, as women with careers who might not be as intrinsically good-looking became more highly valued than—or at least as equally valued as—women for whom appearance was a primary asset.
But as Goldin’s co-author Larry Katz explained:
Potential losers in this equation, in addition to trophy wives, are women with poor career prospects.
The clear winners are women with careers and, of course, the men they marry… Guys have more money, more sex, and less responsibility.
One side effect of the availability of contraception to better educated women was that young women with poor career prospects were also left with a pool of more unattractive men to marry.
Many of these young women who wanted to have baby chose just to have the child, and perhaps marry the father later if the responsibilities of fatherhood turned him into marriage material.
This reversal in order of parenthood and marriage among less well educated young women was one of the surprising social developments in the mid to late 20th century.


Recent Comments