Is the Mother Country catching up with Down Under? Real GDP per working age New Zealander, British and Australian, detrended, 1956 –2013

Figure 1: Real GDP per New Zealander, British and Australian aged 15-64, converted to 2013 price level with updated 2005 EKS purchasing power parities, 1956-2013

image

Source: Computed from OECD Stat Extract and The Conference Board, Total Database, January 2014, http://www.conference-board.org/economics

Figure 2: Real GDP per New Zealander, British and Australian aged 15-64, converted to 2013 price level with updated 2005 EKS purchasing power parities, 1.9 per cent detrended, 1956-2013

image

Source: Computed from OECD Stat Extract and The Conference Board, Total Database, January 2014, http://www.conference-board.org/economics

Average tax rates on consumption, investment, labour and capital in Australia and New Zealand, 1959-2011–updated

Cara McDaniel went to the mammoth task of constructing average tax rates for 15 OECD countries over the period 1950-2003 for consumption, investment, labour and capital:

Total tax revenue is divided into revenue generated from four different sources: consumption expenditures, investment expenditures, labour income and capital income.

To find the average tax rate, tax revenue from each source is then divided by the appropriate income or expenditure base.

She used that data to examine the role of taxes and productivity growth as forces influencing market hours. She used a calibrated growth model extended to include home production and subsistence consumption, both of which were key features influencing market hours. Her model was simulated for 15 OECD countries. She found the primary force driving changes in market hours is found to be changing labour income tax rates and productivity catch-up relative to the United States is found to be an important secondary force.

I thought I would summarise the tax rate data computed by Cara McDaniel for Australia and New Zealand.

image

Source: Cara McDaniel.

McDaniel’s data on average tax rates on household incomes in Australia and New Zealand suggests that the average tax rate New Zealand household incomes fell by a third since 1986. No estimates were calculated for earlier years for New Zealand.

As for Australia, taxes steadily increased between 1959 and 1987 stabilised until 2005 and then fell a bit.

image

Source: Cara McDaniel.

There is a big spike in the average tax rate on consumption expenditure in New Zealand in 1986 when a GST replaced the pre-existing sales taxes. The average tax rate on New Zealand consumption expenditures and tapered away until the end of2009 and started to increase again.

Not much happened in Australia regarding the average tax rate in consumption expenditures since about 1983 despite the introduction of a GST in 1998.

image

Source: Cara McDaniel.

The average tax rate in capital income in Australia is much higher than in New Zealand. On the other hand, the average tax rate on investment expenditure is much higher New Zealand as compared to Australia.

image

Source : Cara McDaniel.

Taxes on investment expenditures increased quite significantly at the same time that a GST was introduced in New Zealand.

All in all, New Zealand cut taxes on personal income but that tax cut seemed to be pretty much offset by higher taxes on personal consumption through the introduction of a 10% and then 12.5% GST.

The most interesting finding in this database is the sharp increase in the average tax on investment expenditures in the mid-1980s. This prolonged New Zealand’s lost decades – the two decades of next to no GDP growth per working age New Zealander.

Real GDP per New Zealander and Australian aged 15-64, converted to 2013 price level with updated 2005 EKS purchasing power parities, 1956-2013

image

Source: Computed from OECD Stat Extract and The Conference Board, Total Database, January 2014.

New Zealand’s lost decades ended when the average tax rate on investment expenditures started to fall.

How can New Zealand blamed distance for its woes when international technology diffusion is speeding up

I prefer to link MPs pay rises to reductions in the trans-Tasman per capita income gap

https://www.facebook.com/nzgreenparty/photos/a.489359751371.266952.10779081371/10152611659431372/?type=1&theater

Real GDP per capita: Australia, New Zealand and OECD, 1950-2007

Source: econfix.wordpress.com

Did the World Bank just solve the puzzle of low NZ growth relative to Australia?

The World Bank published a major 300 odd page report that discussed puzzles of economic growth around the world included a chapter on New Zealand’s slow economic growth relative to Australia.

The World Bank publication is copyrighted 2015, so I assume that it has been published very recently. However, the data analysis in the chapter on New Zealand stop in 2002.

The conclusions of the World Bank with regard to the emergence of the trans-Tasman income gap were as follows:

The extent of economic freedom—as determined by propelling institutions—evolved in a similar manner in both countries.

The small differences in propelling institutions in both countries mostly netted out and as such cannot account for the differences in economic performance.

One exception was the fiscal position of the state—a rise in public expenditure after the first oil crisis entailed increased tax burdens in both countries.

A particularly sharp rise in taxation in New Zealand (in comparison to Australia) occurred during the country’s second downturn.

Differences in the size of the public sector figure prominently in the analysis of the World Bank of the emergence of the trans-Tasman income gap. The measure by the World Bank of the size of the public sector in New Zealand and Australia is reproduced below – its figure 3.3.

Figure 3.3 Government expenditure in Australia and New Zealand, 1970–2002

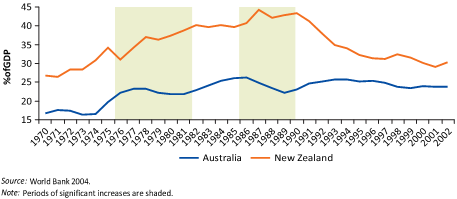
In particular, the World Bank was concerned about the rapid growth in the size of the public sector in New Zealand while the size of the public sector was shrinking in Australia:

In 1977–82 Australia’s government expenditure rose more slowly than that of New Zealand (and in 1975–80 Australia’s expenditure was smaller than New Zealand’s by 13 percent of GDP.

Then, as relative economic growth declined in New Zealand, between 1987 and 1990 public expenditure increased by around 5 percent of GDP from the 1982–86 level. In the meantime, public expenditure in Australia fell by 4 percent of GDP.

As a result, the difference in the general government expenditure level between New Zealand and Australia increased to over 18 percent of GDP in 1987–90.

After 1990 and until 2002 government spending in New Zealand decreased steadily—from approximately 44 percent of GDP in 1990 to roughly 30 percent of in 2002.

In Australia this expenditure was maintained at an average of 25 percent of GDP over the same period (see figure 3.3 with highlighted periods of significant increases of government expenditures in New Zealand).

A spike in the size of state sector in the 1980s may explain a delay in productivity growing rapidly again, but the state sector in New Zealand is now smaller.

Indeed, figure 3.3 above shows that the public sector in New Zealand as measured by general government expenditure has fallen by a quarter in size, by 10 percentage points of GDP in a matter of seven years between 1990 and 1996. There should be rapid growth because of the greatly reduced crowding out by the state sector but that rapid growth is not there.

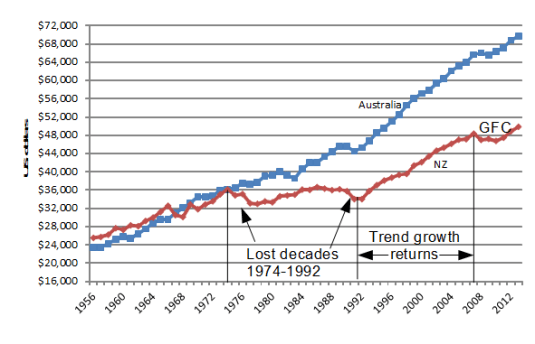
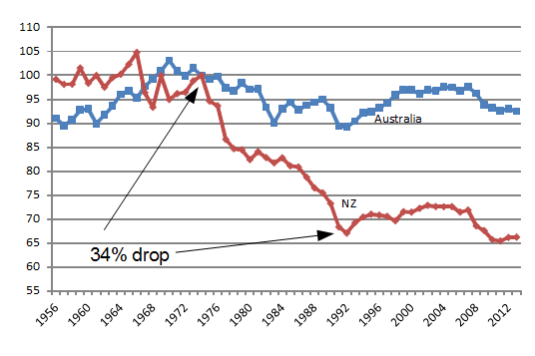
Figure 2 shows that GDP growth per working age New Zealander resumed at its trend rate of 2% after 1992. This resumption of growth was in conjunction with the decline in the size of public sector tax burden rather than after it. Figure 2 shows that there was no significant growth in real GDP per working age New Zealander from 1974 to 1992. New Zealand lost almost two decades of productivity growth. Real GDP per New Zealander aged 15-64 on a purchasing power parity basis dropped from equality with Australia up until 1974 to a 30 per cent gap by 1992.

Figure 2: Real GDP per New Zealander and Australian aged 15-64, converted to 2013 price level with updated 2005 EKS purchasing power parities, 1956-2012

Source: Computed from OECD Stat Extract and The Conference Board, Total Database, January 2014, http://www.conference-board.org/economics

There was no growth rebound when the burden of an oversized public sector was lifted. That is the greater puzzle. The World Bank did not address that greater puzzle. If there is a global pool of useful technological knowledge accessible at a low cost by suitably prepared people, what stops New Zealand from using this knowledge to grow faster until it catches-up with Australia and the USA?

Another puzzle for the World Bank is that it is using general government expenditure estimates by the OECD.

When tax revenue as a percentage of GDP is used to measure the size of the public sector and the burden on private sector initiative, figure 3 shows that the tax burden in the two countries is not that different and is in the low 30% range, not the 40% plus range as is suggested by the general government expenditure data in Figure 3.3.

Figure 3: tax revenue as a percentage of New Zealand and Australian GDP, 1965-2011
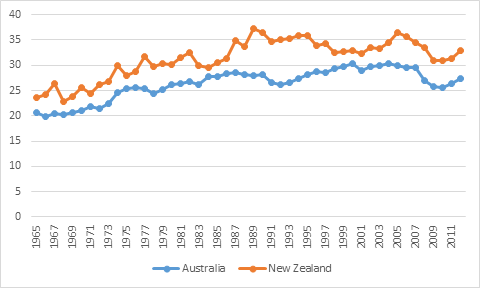
Source: OECD Stats

There are no 14 point gaps in tax burdens in figure 3 as suggested in the World Bank’s analysis. This is because the World Bank’s using general government expenditure shown in its figure 3.3 reproduced above.

A major conclusion about the causes of New Zealand’s poor growth performance in the last few decades should be robust to different measures of the size of the public sector, but it is not.

Economic reforms returned real GDP growth per New Zealander aged 15-64 from no growth from 1974 to 1992 to the previous two per cent trend rate from 1993. There was no sustained productivity growth rebound beyond 2 per cent growth a year for New Zealand to recover the lost ground in the 1980s and 1970s. That is the great puzzle that the World Bank did not address, much less solve.

Real GDP per New Zealander and Australian aged 15-64, PPP, 1956-2013, $US

Figure 1: Real GDP per New Zealander and Australian aged 15-64, converted to 2013 price level with updated 2005 EKS purchasing power parities, 1956-2013, $US

Source: Computed from OECD Stat Extract and The Conference Board, Total Database, January 2014, http://www.conference-board.org/economics

Figure 1 shows that New Zealand lost two decades of growth between 1974 and 1992 after level pegging with Australia for the preceding two decades.

New Zealand returned to trend growth between 1992 and 2007. New Zealand did not make up the lost growth of the previous two decades to catch up to Australia.

Figure 2: Real GDP per New Zealander and Australian aged 15-64, converted to 2013 price level with updated 2005 EKS purchasing power parities, 1.9 per cent detrended, base 100 = 1974, 1956-2013, $US

Source: Computed from OECD Stat Extract and The Conference Board, Total Database, January 2014, http://www.conference-board.org/economics

In Figure 2, a flat line equates to a 1.9% GDP annual growth rate; a falling line is a below trend growth rate; a rising line is an above 1.9% growth rate.

Figure 2 shows that there was a 34% drop against trend between 1974 and 1992; a return to trend growth and slightly better between 1992 and 2007; and then a recession to 2010.

Australia had its ups and downs since 1956 but essentially grew at the trend growth rate of 1.85% since 1970. The so-called resources boom in Australia does not show up in Figures 1 or 2.

There was no growth rebound in New Zealand to recover the lost ground, either in the lost decades between 1974 and 1992, or after the Global Financial Crisis. The strong GDP growth in Australia after that Keating recession in 1991 is an example of the country recovering lost ground after a recession – See Figure 2.

A trend growth rate of 1.9% is the 20th century trend growth rate that Edward Prescott currently estimates for the global industrial leader, which is the United States of America.

Euroland and Japan compared since 2008

https://twitter.com/Birdyword/status/533264502142545920

The Top 1% of income earners in NZ are lazy – the Occupy Movement have nothing to protest about – updated

The NZ top 1% share has been steady at 8-9% since the mid-1990s. The top 1%’s share rose strongly in the USA in recent decades, from 13% in the mid-1980s to 19% in 2012.

Figure 1: Top 1% income shares, USA, New Zealand and Sweden, 1970-2012

clip_image002

Source: The World Top Income Database at http://topincomes.g-mond.parisschoolofeconomics.eu/#Database

The top 1% in New Zealand is so lazy that Sweden is overtaking it – See figure 1.

The Occupy crowd blame everything from the global financial crisis to a bad environment on growing inequality and the top 1%. Such an argument has no foundation in fact in New Zealand.

Income inequality as measured by the Gini coefficient has not risen much in New Zealand for 20 years – See figure 2. How can the poor be getting getting poorer, ground under by  the yoke of capitalism, if the rich are not getting richer. The occupy movement should apply for unemployment benefits and seek career guidance.

Figure 2: Gini coefficient New Zealand 1980-2015

clip_image002[7]

Source: Bryan Perry, Household incomes in New Zealand: Trends in indicators of inequality and hardship 1982 to 2013. Ministry of Social Development (July 2014).

The last major increase in income inequality in New Zealand was  in the late 1980s and early 1990s and that was followed by a long economic boom – See figure 3 .

Figure 3:  Real GDP per New Zealander and Australian aged 15-64, converted to 2013 price level with updated 2005 EKS purchasing power parities, 1956-2012

image

Source: Computed from OECD Stat Extract and The Conference Board, Total Database, January 2014, http://www.conference-board.org/economics .

This long boom was after two decades of next to no economic growth in the 1970s and 1980s in New Zealand  – see figure 3 . This depression between 1974 and 1992 was New Zealand’s lost decades.

Figure 4 shows that both the lost decades of economic growth in New Zealand and the emergence of the trans-Tasman income gap the seemed to somewhat coincide with the top 1% of earners in Australia increasing their share of income from 6% to 10% of total incomes while the New Zealand top 1% sat on their hands. They are such lazy devils.

Figure 4: Top 1% income shares, USA, New Zealand and Australia, 1970-2012

image

Source: The World Top Income Database at http://topincomes.g-mond.parisschoolofeconomics.eu/#Database

Next Newer Entries

The Undercover Historian

Beatrice Cherrier's blog

Matua Kahurangi

Celebrating humanity's flourishing through the spread of capitalism and the rule of law

Temple of Sociology

Celebrating humanity's flourishing through the spread of capitalism and the rule of law

Velvet Glove, Iron Fist

Celebrating humanity's flourishing through the spread of capitalism and the rule of law

CAMERA UK

COMMITTEE FOR ACCURACY IN MIDDLE EAST REPORTING AND ANALYSIS

Why Evolution Is True

Why Evolution is True is a blog written by Jerry Coyne, centered on evolution and biology but also dealing with diverse topics like politics, culture, and cats.

Down to Earth Kiwi

Celebrating humanity's flourishing through the spread of capitalism and the rule of law

NoTricksZone

Celebrating humanity's flourishing through the spread of capitalism and the rule of law

Homepaddock

A rural perspective with a blue tint by Ele Ludemann

Kiwiblog

DPF's Kiwiblog - Fomenting Happy Mischief since 2003

The Dangerous Economist

Celebrating humanity's flourishing through the spread of capitalism and the rule of law

Watts Up With That?

The world's most viewed site on global warming and climate change

The Logical Place

Tim Harding's writings on rationality, informal logic and skepticism

Doc's Books

A window into Doc Freiberger's library

The Risk-Monger

Let's examine hard decisions!

Uneasy Money

Commentary on monetary policy in the spirit of R. G. Hawtrey

Barrie Saunders

Thoughts on public policy and the media

Liberty Scott

Celebrating humanity's flourishing through the spread of capitalism and the rule of law

Point of Order

Politics and the economy

James Bowden's Blog

A blog (primarily) on Canadian and Commonwealth political history and institutions

Science Matters

Reading between the lines, and underneath the hype.

Peter Winsley

Economics, and such stuff as dreams are made on

A Venerable Puzzle

"The British constitution has always been puzzling, and always will be." --Queen Elizabeth II

The Antiplanner

Celebrating humanity's flourishing through the spread of capitalism and the rule of law

Bet On It

Celebrating humanity's flourishing through the spread of capitalism and the rule of law

History of Sorts

WORLD WAR II, MUSIC, HISTORY, HOLOCAUST

Roger Pielke Jr.

Undisciplined scholar, recovering academic

Offsetting Behaviour

Celebrating humanity's flourishing through the spread of capitalism and the rule of law

JONATHAN TURLEY

Res ipsa loquitur - The thing itself speaks

Conversable Economist

Celebrating humanity's flourishing through the spread of capitalism and the rule of law

The Victorian Commons

Researching the House of Commons, 1832-1868

The History of Parliament

Articles and research from the History of Parliament Trust

Books & Boots

Reflections on books and art

Legal History Miscellany

Posts on the History of Law, Crime, and Justice

Sex, Drugs and Economics

Celebrating humanity's flourishing through the spread of capitalism and the rule of law

European Royal History

Exploring the Monarchs of Europe

Tallbloke's Talkshop

Cutting edge science you can dice with

Marginal REVOLUTION

Small Steps Toward A Much Better World

NOT A LOT OF PEOPLE KNOW THAT

“We do not believe any group of men adequate enough or wise enough to operate without scrutiny or without criticism. We know that the only way to avoid error is to detect it, that the only way to detect it is to be free to inquire. We know that in secrecy error undetected will flourish and subvert”. - J Robert Oppenheimer.

STOP THESE THINGS

The truth about the great wind power fraud - we're not here to debate the wind industry, we're here to destroy it.

Lindsay Mitchell

Celebrating humanity's flourishing through the spread of capitalism and the rule of law

Alt-M

Celebrating humanity's flourishing through the spread of capitalism and the rule of law

croaking cassandra

Economics, public policy, monetary policy, financial regulation, with a New Zealand perspective

The Grumpy Economist

Celebrating humanity's flourishing through the spread of capitalism and the rule of law

International Liberty

Restraining Government in America and Around the World

Environmental and Urban Economics

Celebrating humanity's flourishing through the spread of capitalism and the rule of law

Supply and Demand (in that order)

Celebrating humanity's flourishing through the spread of capitalism and the rule of law