Margaret Thatcher’s economic legacy | The Economist
02 May 2019 Leave a comment
in budget deficits, business cycles, economic growth, economic history, economics of bureaucracy, economics of regulation, fiscal policy, global financial crisis (GFC), industrial organisation, labour economics, macroeconomics, monetary economics, privatisation, property rights, Public Choice, unemployment, unions Tags: British politics, Margaret Thatcher


Thatcher accused of sinking the ship!
20 Jul 2018 Leave a comment
in defence economics, laws of war, war and peace Tags: Falklands war, Margaret Thatcher
Thatcher on Consensus vs Conviction
23 Dec 2017 Leave a comment
in comparative institutional analysis, constitutional political economy, Public Choice Tags: Margaret Thatcher
Margaret Thatcher on Socialism
11 Dec 2017 Leave a comment
in income redistribution, poverty and inequality, Public Choice Tags: British politics, Margaret Thatcher
Left of @uklabour to blame for Thatchernomics
06 Jul 2016 Leave a comment
in income redistribution, Public Choice Tags: British economy, British politics, Leftover Left, Margaret Thatcher
Thatcher was able to implement her policies because the Labour Party of the 1980s failed to offer a credible alternative government. In the 1983 general election, Labour ran on policy such as
- leaving the European Economic Community,
- abolishing the House of Lords,
- abandoning the United Kingdom‘s nuclear deterrent by cancelling Trident and removing cruise missiles.
After barely upholding the social democratic alliance in 1983, British labour did slightly better after four more years of Maggie Thatcher. Labour won 30% of the vote in 1987, up from 27%. in 1983 The social democratic alliance drop down from 25% to 22%

One reason was clever responses are national security in the 1987 election such as this
On 24 May, Kinnock was interviewed by David Frost and claimed that Labour’s alternative defence strategy in the event of a Soviet attack would be “using the resources you’ve got to make any occupation totally untenable”.
In a speech two days later Mrs. Thatcher attacked Labour’s defence policy as a programme for “defeat, surrender, occupation, and finally, prolonged guerrilla fighting… I do not understand how anyone who aspires to Government can treat the defence of our country so lightly.”
In 1992, Labour still lost the election by a landslide despite 13 years of Thatcher good and ended its commitment to unilateral nuclear disarmament, high taxes and old-style nationalisation. Go left, go left so damaged the labour brand that a new generation of leaders was required.
The British electorate had every chance to vote for a hard left Labour in the 1980s. It rejected it resoundingly and almost voted in the social democratic alliance as the main opposition party.
Taxpayers Alliance mistaken about tax revenues as a stable % of GDP @the_tpa
12 Apr 2016 Leave a comment
in applied price theory, economic history, public economics Tags: British economy, British taxes, growth of government, Margaret Thatcher, size of government, taxation and entrepreneurship, taxation and investment, taxation and labour supply, Taxpayers Alliance
The British Taxpayers Alliance got carried away a bit when it said taxes as a share of British GDP have not varied much over the last 50 years or so. Margaret Thatcher would be turning in her grave.
A stable tax take is more the case in the USA. Federal tax receipts stay within the range of 18-20% of U.S. GDP as shown in the charts below and above.
There were large cuts in the top tax rates in the USA without any fall in tax revenues as a percentage of GDP because of base broadening.
Margaret Thatcher really did make a dent in taxes as a share of GDP in the 1980s. They fell by 5% of GDP but then went back up again in the 1990s as is shown in the Centre for Policy Studies chart below.
That 5% drop was a big variation as a share of GDP which is also shown in the Taxpayers Alliance chart if you look closely at the 1980s. That sharp drop in taxes as a share of British GDP is clearer in the Centre for Policy Studies chart because it magnifies the data.
There are also big changes in the British tax mix in the 1970s and 1980s. The large rise in tax in personal income in the 1970s as a percentage of GDP, also shown in both British charts above as well is the one below, coincided with the rise of the British disease and British economy becoming widely known as the sick man of Europe.

Source: OECD Stat.
The large decline in taxation in personal income under Thatchernomics was followed by an economic boom. The UK grew at above the trend annual real GDP growth to 1.9% for most of the period from the early 1980s to 2007 as shown in the detrended data in the chart below.

Source: Computed from OECD Stat Extract and The Conference Board. 2015. The Conference Board Total Economy Database™, May 2015,http://www.conference-board.org/data/economydatabase/.
In the above chart, a flat line is growth at the same rate as the USA for the 20th century, which was 1.9% for GDP per working age person on a purchasing power parity basis. The USA’s trend growth rate in the 20th century is taken as the trend rate of growth of the global technological frontier.
A falling line in the above chart is growth in real GDP per working age person, PPP at less than the trend rate of 1.9% per annum while a rising line is real growth in GDP per working age person in excess of the trend rate.
General government expenditure as % of US, British and Canadian GDP since 1960
28 Feb 2016 Leave a comment
in economic history, fiscal policy, macroeconomics, politics - USA, public economics Tags: British economy, Canada, growth of government, Margaret Thatcher, size of government, Thatchernomics, Tony Blair
Both the British and Canadian economies experienced major winding backs in the size of government. Only the UK, under neoliberal pawn and closet Thatcherite Tony Blair, was that undone. He is now despised by many Labour Party members including its current leader for this record.

Data extracted on 23 Feb 2016 07:45 UTC (GMT) from OECD.Stat.
Margaret Thatcher on the concept of a false consciousness
21 Nov 2015 Leave a comment
in liberalism, Marxist economics Tags: all of communism, capitalism and freedom, class consciousness, false consciousness, Margaret Thatcher, preference formation, rational ignorance, rational irrationality
Margaret Thatcher on peacemakers
16 Nov 2015 Leave a comment
in defence economics, war and peace Tags: game theory, Margaret Thatcher
French, German, Italian and British equilibrium unemployment rates, 1968 – 2017
10 Nov 2015 Leave a comment
in business cycles, economic history, economics of regulation, Euro crisis, job search and matching, labour economics, labour supply, macroeconomics Tags: British economy, employment law, equilibrium unemployment rate, Eurosclerosis, France, Germany, Italy, labour market reforms, Margaret Thatcher, Thatchernomics, The British Disease
Unlike the USA, the German, Italian, British and French equilibrium unemployment rates all show fluctuations that reflect changes in their underlying economic circumstances and labour market reforms. The case of the British, the rise of the British disease and Thatchernomics. The case of German, its equilibrium unemployment rate rose after German unification and then fell after the labour market reforms of 2002 to 2005.

Source: OECD Economic Outlook November 2015 Data extracted on 10 Nov 2015 07:07 UTC (GMT) from OECD.Stat.
Did the British disease pass retirees by? British retiree and non-retiree median real household income by Prime Minister since 1977
03 Nov 2015 Leave a comment
in applied welfare economics, economic growth, economic history, macroeconomics, poverty and inequality Tags: British economy, British politics, Margaret Thatcher, Tony Blair
The British disease and the horrors of Thatchernomics past British retirees by as did pretty much the Global Financial Crisis. Slow and steady as she goes under every Prime Minister since 1977 has been year in year out result for the real disposable median incomes of British retired households. Despite it all, British retiree household incomes increased by 170% since the winter of discontent. The fastest growth in retiree incomes was under Tony Blair.
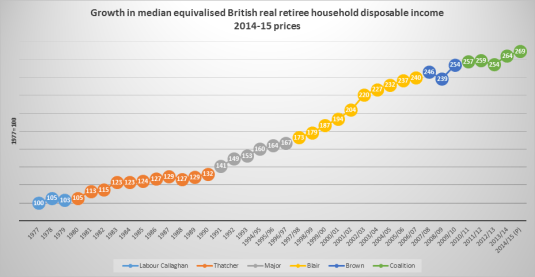
Source: Release Edition Reference Tables – ONS.
Notes:
1 Households are ranked by their equivalised disposable incomes, using the modified-OECD scale.
2 1994/95 represents the financial year ending 1995, and similarly through to 2014/15, which represents the financial year ending 2015.
3 Income figures have been deflated to 2014/15 prices using an implied deflator for the household sector.
It has been a much rockier ride for British households yet to retire. Once again, the only time a sustained real income increases for non-retired households was under Thatcher and Blair. Despite it all, household real incomes have doubled since the winter of discontent. The majority of that doubling was under the dead hand of Tony Blair. British Labour now spends a considerable amount of time repudiating that time of unusually rapid household income growth across all of British society.
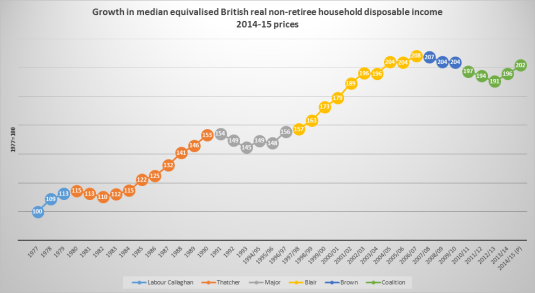
Source: Release Edition Reference Tables – ONS.
Notes:
1 Households are ranked by their equivalised disposable incomes, using the modified-OECD scale.
2 1994/95 represents the financial year ending 1995, and similarly through to 2014/15, which represents the financial year ending 2015.
3 Income figures have been deflated to 2014/15 prices using an implied deflator for the household sector.

Recent Comments