Johan Norberg: The Truth about Swedish Socialism
05 Jun 2018 1 Comment
in applied price theory, economic history, macroeconomics, Public Choice, public economics Tags: growth of government, size of government, sweet
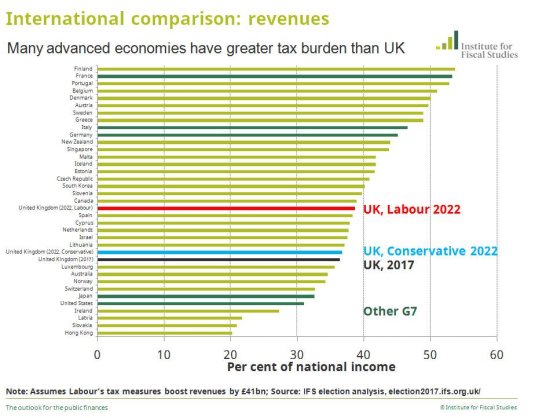
Efficient taxes lead to higher taxes
19 Mar 2017 1 Comment
in economic growth, fiscal policy, macroeconomics, public economics Tags: growth of government, size of government
Why so few successful left-wing populists
16 Aug 2016 Leave a comment
in politics - Australia, politics - New Zealand, politics - USA, Public Choice Tags: economics and immigration, growth of government, left-wing populists, right-wing populists, size of government, social insurance, welfare state
The Twitter Left is doing its best to attribute the surge against globalisation and immigration to inequality. This is despite the main beneficiary at the ballot box is right-wing populists.
The beneficiaries in the last few years were UKIP, the French National Front, Alternative for Germany, various pro-welfare state but anti-immigration parties in the rest of Europe, Pauline Hanson and Donald Trump. Barely a left wing party in sight outside of Greece.

Source: Only a third of the EU is governed by the centre-left | World news | The Guardian.
Bernie Sanders is a fake left-wing populist because much of his support comes from college students and the university educated, not the aroused working class. These college students are unwilling to pay more than $1000 in taxes for the socialist revolution especially if they have a job.
At the last New Zealand election, two-thirds of the electorate voted for other than centre-left and left-wing parties. The hard left party, Mana-Internet, won 1% of the party vote despite having millions of dollars in campaign donations from a criminal fugitive hoping to avoid extradition.
These right-wing populists combine a heady brew of nationalism and social conservatism, scepticism about market competition, strong support for social security and old-age pensions but not welfare dependency, and opposition to immigration, imports and cultural change. The rise of the parties are not the first signs of an aroused working class seeking to overthrow capitalism. Face up to it.
Why the polarisation of Congress? The Great Restraint? Sound-bite politics?
01 Jul 2016 Leave a comment
in constitutional political economy, economics of media and culture, income redistribution, politics - USA, Public Choice, rentseeking Tags: competition for political influence, congressional polarisation, growth of government, interest groups, political polarisation, size of government, soundbites, special interests
My two cents on the sharp rise of partisanship and congressional polarisation is they are driven by the great restraint in the growth of government spending in the 1980s.
From 1950 to 1980 the size of government doubled but then stopped dead in the 1980s. This great restraint on the growth of government happened everywhere. It was not just Thatcher’s Britain or Reagan’s America. It was everywhere, France and Germany, and even Scandinavia.

Source: Sam Peltzman, The Socialist Revival? (2012).
Peltzman’s data which I have charted has government spending in the USA, Britain, France and Scandinavia doubling between 1950 and 1980, and then nothing much happened between 1980 and 2007 – the size of government was pretty flat as a share of GDP for 27 years.
Governments everywhere hit a brick wall in terms of their ability to raise further tax revenues. Political parties of the Left and Right recognised this new reality.
Government spending grew in many countries in the m-d-20th century because of demographic shifts, more efficient taxes, more efficient spending, a shift in the political power from those taxed to those subsidised, shifts in political power among taxed groups, and shifts in political power among subsidised groups Importantly for explaining later political polarisation, that growth of government was concentrated in four programs – defence, health, education and income security
The median voter in all countries was alive to the power of incentives and to not killing the goose that laid the golden egg which underwrote the initial growth in the size of government. The rising deadweight losses of taxes, transfers and regulation limit inefficient policies and the sustainability of redistribution.
After 1980, the taxed, regulated and subsidised groups had an increased incentive to converge on new lower cost modes of redistribution to protect what they had. More efficient taxes, more efficient spending, more efficient regulation and a more efficient state sector reduced the burden of taxes on the taxed groups. Reforms ensued after 1980 led by parties on the Left and Right, with some members of existing political groupings benefiting from joining new coalitions.
A lot more is at stake when the main political battleground is dividing a relatively fixed revenue pie post-1980 than a growing pie Between 1950 and 1980. Fiscally conservative voters will elect parties strongly committed to no new taxes. Their opponents will look for equally ideologically committed parties. Peltzman makes the very interesting point that:
There is no new program in the political horizon that seems capable of attaining anything like the size of any of these four. For the time being the future government rest on the extent of existing mega programs.
Health and income security account for 55% of total government spending in the OECD. It is in these two programs where the future of the growth of government lie.
The pressure for that growth in government will come from the elderly. Governments will have to choose between high taxes on the young to fund the current generosity of social insurance, healthcare and old-age pensions or find other options. Peltzman explains this political tension for programs benefiting the elderly in his essay The Socialist Revival:
Deficit financing of future growth in these programs becomes increasingly problematic. So we now have the seeds of political conflict rather than consensus.
These very large programs confer substantial benefits on some. These beneficiaries resist any change in the status quo. But the benefits have to be financed at substantial cost to today’s workers. Many of them will not benefit on balance from these programs over their lifetimes. It is by no means clear whether the number of winners exceeds the number of losers today.
Policies that were once unthinkable now can be discussed and even implemented here and there. These include increased retirement ages, less generous public health care programs, more reliance on private saving for retirement and so forth.
Given that intergenerational and other struggles over who is taxed and who faces benefit cuts, middle-of-the-road politicians lose their appeal to the electorate.
Another reason for greater political polarisation is the rising cost of time. Sound-bites news programs and current affairs are now a couple of seconds long when they used to be 15 seconds long maybe 30 years ago.

People have less time to pay attention to politics so they want to work out quickly from short sound-bites whether the politicians they are contemplating supporting are made of the right stuff. For voters in a hurry, conviction politicians are more appealing be they of the left or of the right. Voters want someone who will hold fast against new taxes or for new taxes as the case may be. Much is at stake as Sam Peltzman explained in his 2012 essay The Socialist Revival:
The steady growth of the old age population share is on the verge of a substantial acceleration… This means that government health care and public pension spending growth will also have to accelerate merely to keep the promises implicit in present programs.
The political economy will have to choose between higher taxes on the young to keep these promises, an accelerated shrinkage of the rest of the budget or less generous public health and pension programs. It is not clear yet which way the decision will go.
What is clear is that for the first time since the invention of the welfare state the magnitude and generosity of its signature programs is at political risk.
In this stand-off between those who might have to pay more in taxes and those who might receive less in old age pensions, welfare benefits and services including healthcare, neither side wants a politician naturally inclined to blink and compromise. They will elect politicians who hang tough for their side of the argument and their share of the budget.
why no protests against #UBI bureaucratic job losses but #TPPANoWay protests aplenty about jobs?
08 Jun 2016 Leave a comment
in fiscal policy, labour economics, politics - Australia, politics - New Zealand, politics - USA, poverty and inequality, public economics Tags: expressive voting, growth of government, rational rationality, size of government, social insurance, universal basic income

The universal basic income is a rare bird for the left. It is the only time the usual suspects on the left are happy to cut government bureaucracy.

Furthermore, the left makes no inquiries as to how these redundant bureaucrats who administered the welfare state will find jobs. The market is left to work its magic for once. How convenient.

When a tariff cut is proposed, a trade deal signed, or job reduction in a bureaucracy suggested perhaps as the result of a privatisation, left-wing activists chain themselves to factory gates or government offices in solidarity. The social upheaval from the job losses among existing workers and their dim prospects of reemployment are paramount in their minds.

Why in the case of a universal basic income is the left so relaxed about job losses. Indeed, it celebrates as an advantage of a universal basic income that “Most of the bureaucracy of the welfare system [is] swept away” .

The universal basic income is the only time the left welcomes a reduction in bureaucracy and the role in the state. This switch from welfare payments to a universal basic income does not make those on the benefit any better off. Normally they are worse off under a universal basic income.
None of the the less well groups which of the concern of the left gain from a universal basic income. Despite this, they sell the jobs of their comrades in the public sector down the river.

I cannot believe the explanation is job losses are OK as long as they are the result of left-wing policies. Unless the labour market is liberalised, its ability to find new jobs for workers, for example, made redundant in the public sector after the introduction of a universal basic income is not any under greater than under a right-wing policy that costs jobs.
NZ #UBI can be only $4,700 @JordNZ @GrantRobertson1 @GeoffSimmonz
04 Jun 2016 Leave a comment
in labour economics, labour supply, politics - New Zealand, poverty and inequality Tags: expressive voting, growth of government, New Zealand Labor Party, rational irrationality, size of government, social insurance, universal basic income, welfare state
A universal basic income in New Zealand will have to be financed by a great big new tax because the existing ones are not enough according to the Economist calculations below.

HT: Paul Kerby.
Tax bracket creep in Australia
24 May 2016 Leave a comment
in politics - Australia, politics - New Zealand, public economics Tags: bracket creep, growth of government, size of government, taxation and inflation
Be careful for what you wish for when using irrationality as a rationale for the scope of government
07 May 2016 Leave a comment
in applied price theory, comparative institutional analysis, constitutional political economy, economics of information, Public Choice Tags: behavioural public choice, growth of government, rational irrationality, size of government

Source: Gary Lucas and Slavisa Tasic‘s "Behavioral Public Choice and the Law" (West Virginia Law Review, 2015) via Bryan Caplan
@BernieSanders nothing is free in Denmark
24 Apr 2016 Leave a comment
in applied welfare economics, fiscal policy, politics - USA, public economics Tags: 2016 presidential election, Denmark, growth of government, size of government, social insurance, taxation and labour supply, welfare state

SPECIFIC TYPES OF IRRATIONALITY THAT CAUSE GOVERNMENT FAILURE
21 Apr 2016 Leave a comment
in applied price theory, comparative institutional analysis, constitutional political economy, economics of bureaucracy, economics of information, Public Choice Tags: behavioural public choice, growth of government, rational irrationality, size of government

Source: Gary Lucas and Slavisa Tasic‘s "Behavioral Public Choice and the Law" (West Virginia Law Review, 2015) via Bryan Caplan
Forget avoidance outrage: public’s real attitude to tax is revealed by their actions @JordNZ
21 Apr 2016 Leave a comment
in applied price theory, constitutional political economy, economic history, economics of media and culture, politics - Australia, politics - New Zealand, politics - USA, Public Choice, public economics Tags: British economy, British politics, expressive voting, growth of government, rational irrationality, revealed preference, size of government, voter demographics

Taxpayers Alliance mistaken about tax revenues as a stable % of GDP @the_tpa
12 Apr 2016 Leave a comment
in applied price theory, economic history, public economics Tags: British economy, British taxes, growth of government, Margaret Thatcher, size of government, taxation and entrepreneurship, taxation and investment, taxation and labour supply, Taxpayers Alliance
The British Taxpayers Alliance got carried away a bit when it said taxes as a share of British GDP have not varied much over the last 50 years or so. Margaret Thatcher would be turning in her grave.
A stable tax take is more the case in the USA. Federal tax receipts stay within the range of 18-20% of U.S. GDP as shown in the charts below and above.
There were large cuts in the top tax rates in the USA without any fall in tax revenues as a percentage of GDP because of base broadening.
Margaret Thatcher really did make a dent in taxes as a share of GDP in the 1980s. They fell by 5% of GDP but then went back up again in the 1990s as is shown in the Centre for Policy Studies chart below.
That 5% drop was a big variation as a share of GDP which is also shown in the Taxpayers Alliance chart if you look closely at the 1980s. That sharp drop in taxes as a share of British GDP is clearer in the Centre for Policy Studies chart because it magnifies the data.
There are also big changes in the British tax mix in the 1970s and 1980s. The large rise in tax in personal income in the 1970s as a percentage of GDP, also shown in both British charts above as well is the one below, coincided with the rise of the British disease and British economy becoming widely known as the sick man of Europe.

Source: OECD Stat.
The large decline in taxation in personal income under Thatchernomics was followed by an economic boom. The UK grew at above the trend annual real GDP growth to 1.9% for most of the period from the early 1980s to 2007 as shown in the detrended data in the chart below.

Source: Computed from OECD Stat Extract and The Conference Board. 2015. The Conference Board Total Economy Database™, May 2015,http://www.conference-board.org/data/economydatabase/.
In the above chart, a flat line is growth at the same rate as the USA for the 20th century, which was 1.9% for GDP per working age person on a purchasing power parity basis. The USA’s trend growth rate in the 20th century is taken as the trend rate of growth of the global technological frontier.
A falling line in the above chart is growth in real GDP per working age person, PPP at less than the trend rate of 1.9% per annum while a rising line is real growth in GDP per working age person in excess of the trend rate.
The Swedish tax mix as a percentage of GDP since 1965
21 Mar 2016 Leave a comment
in economic history, public economics Tags: growth of government, size of government, Sweden

Source: OECD Stat.
British tax mix as a percentage of GDP
19 Mar 2016 Leave a comment
in economic growth, economic history, entrepreneurship, fiscal policy, macroeconomics, public economics Tags: British disease, British economy, growth of government, sick man of Europe, size of government, taxation and entrepreneurship, taxation and investment, taxation and labour supply, Thatchernomics
The large rise in tax in personal income in the 1970s coincided with the rise of the British disease and British economy becoming widely known as the sick man of Europe. The large decline in taxation in personal income under Thatchernomics was followed by an economic boom.

Source: OECD Stat.

Recent Comments